29
/
en
AIzaSyAYiBZKx7MnpbEhh9jyipgxe19OcubqV5w
April 1, 2024
126929
El Salvador
SLV
true
2
1
Social contributions (% of revenue)
2014,2013,2012,2011,2010,2009,2008,2007,2006,2005,2004,2003,2002,2001,2000,1999
Download
Global statistics library →El Salvador →

Social contributions (% of revenue)

This statistics in other country:
AfghanistanAlbaniaAngolaArgentinaArmeniaAustraliaAustriaAzerbaijanBarbadosBelarusBelgiumBelizeBeninBhutanBoliviaBosnia and HerzegovinaBrazilBulgariaBurundiCabo VerdeCanadaCaribbean small statesCentral African RepublicCentral Europe and the BalticsChileChinaColombiaCongo, Rep.Costa RicaCote d'IvoireCroatiaCyprusCzech RepublicDenmarkDominican RepublicEgypt, Arab Rep.El SalvadorEstoniaEthiopiaEuro areaEurope & Central AsiaEurope & Central Asia (excluding high income)Europe & Central Asia (IDA & IBRD countries)European UnionFijiFinlandFranceGambia, TheGeorgiaGermanyGhanaGreeceGuatemalaHigh incomeHondurasHong Kong SAR, ChinaHungaryIBRD onlyIcelandIDA blendIndiaIndonesiaIran, Islamic Rep.IraqIrelandIsraelItalyJamaicaJapanJordanKazakhstanKenyaKorea, Rep.Late-demographic dividendLatin America & Caribbean Latin America & Caribbean (excluding high income)Latin America & the Caribbean (IDA & IBRD countries)LatviaLebanonLiberiaLithuaniaLuxembourgMacao SAR, ChinaMacedonia, FYRMadagascarMaltaMauritiusMexicoMoldovaMongoliaMoroccoMozambiqueNamibiaNetherlandsNew ZealandNorth AmericaNorwayOECD membersPanamaPapua New GuineaParaguayPeruPolandPortugalPost-demographic dividendRomaniaRussian FederationSan MarinoSao Tome and PrincipeSerbiaSeychellesSlovak RepublicSloveniaSmall statesSouth AfricaSouth AsiaSouth Asia (IDA & IBRD)SpainSri LankaSt. Kitts and NevisSwedenSwitzerlandSyrian Arab RepublicTajikistanThailandTrinidad and TobagoTunisiaTurkeyUkraineUnited Arab EmiratesUnited KingdomUnited StatesUpper middle incomeUruguayVenezuela, RBZambiaZimbabwe
Timeline:
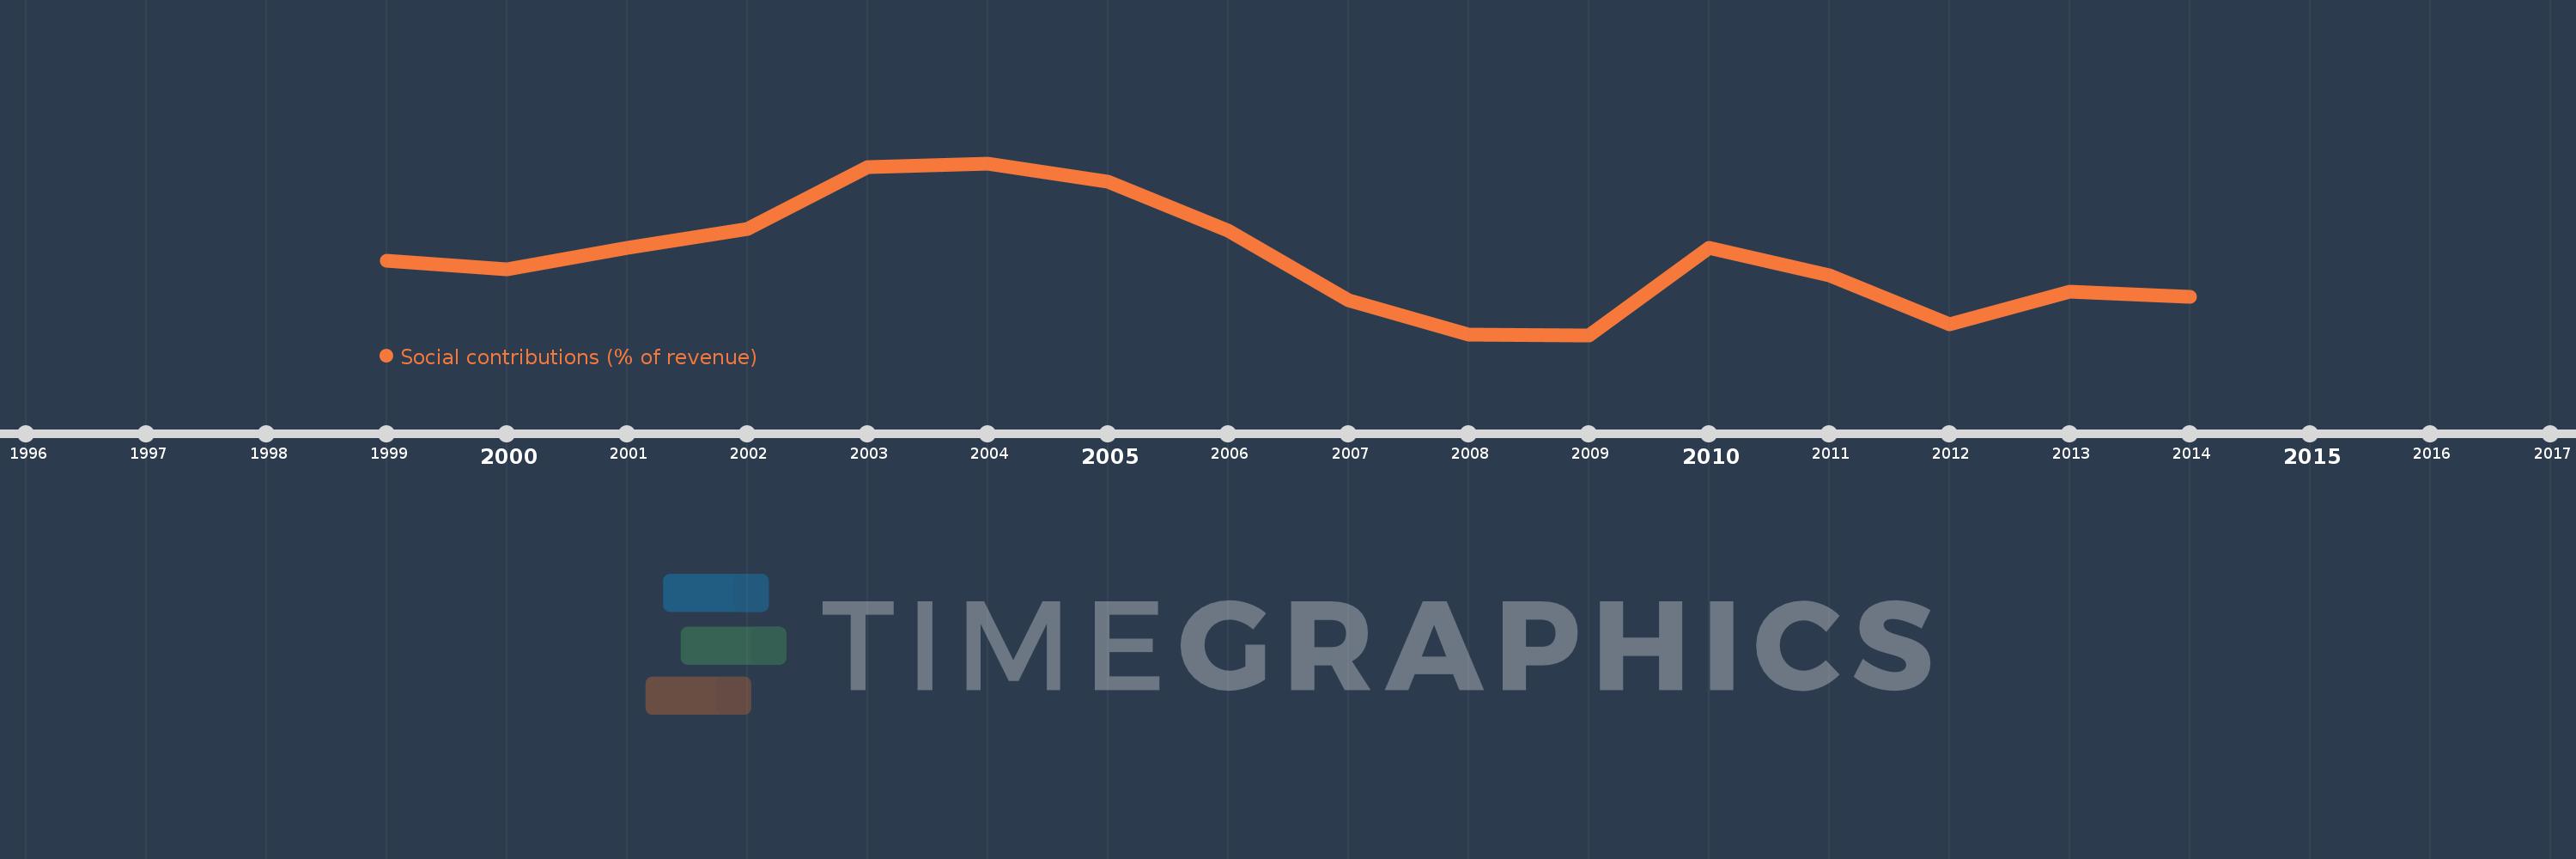
This timeline shows a graph from 1999 to 2014 of El Salvador. No data until 1998. Number of actual observations by date: 16.
Source name:
World Development Indicators
Source organization:
International Monetary Fund, Government Finance Statistics Yearbook and data files.
Categories, topics:
Public Sector
Last updated:
apr 23, 2017
Indicators value changes by year
Mean:
12.092
Minimum:
9.903
jan 1, 2009
Maximum:
14.9
jan 1, 2004
At the date of observation
Value
Absolute change
Change from previous value
jan 1, 1999
12.056
+12.056
0.0%
jan 1, 2000
11.826
-0.229
-1.9%
jan 1, 2001
12.431
+0.604
5.11%
jan 1, 2002
12.986
+0.555
4.47%
jan 1, 2003
14.778
+1.792
13.8%
jan 1, 2004
14.9
+0.121
0.82%
jan 1, 2005
14.365
-0.534
-3.59%
jan 1, 2006
12.931
-1.434
-9.98%
jan 1, 2007
10.918
-2.013
-15.57%
jan 1, 2008
9.909
-1.009
-9.24%
jan 1, 2009
9.903
-0.007
-0.07%
jan 1, 2010
12.448
+2.545
25.7%
jan 1, 2011
11.642
-0.806
-6.48%
jan 1, 2012
10.206
-1.436
-12.33%
jan 1, 2013
11.165
+0.958
9.39%
jan 1, 2014
11.003
-0.161
-1.44%
Ranking of countries by current statistics by years

Comments:

Send
PremiumAbout & FeedbackTermsPrivacy
logo
© 2022 Selected Technologies LLC – Morgan Hill, California