29
/
en
AIzaSyAYiBZKx7MnpbEhh9jyipgxe19OcubqV5w
April 1, 2024
30310
Euro area
EMU
false
2
1
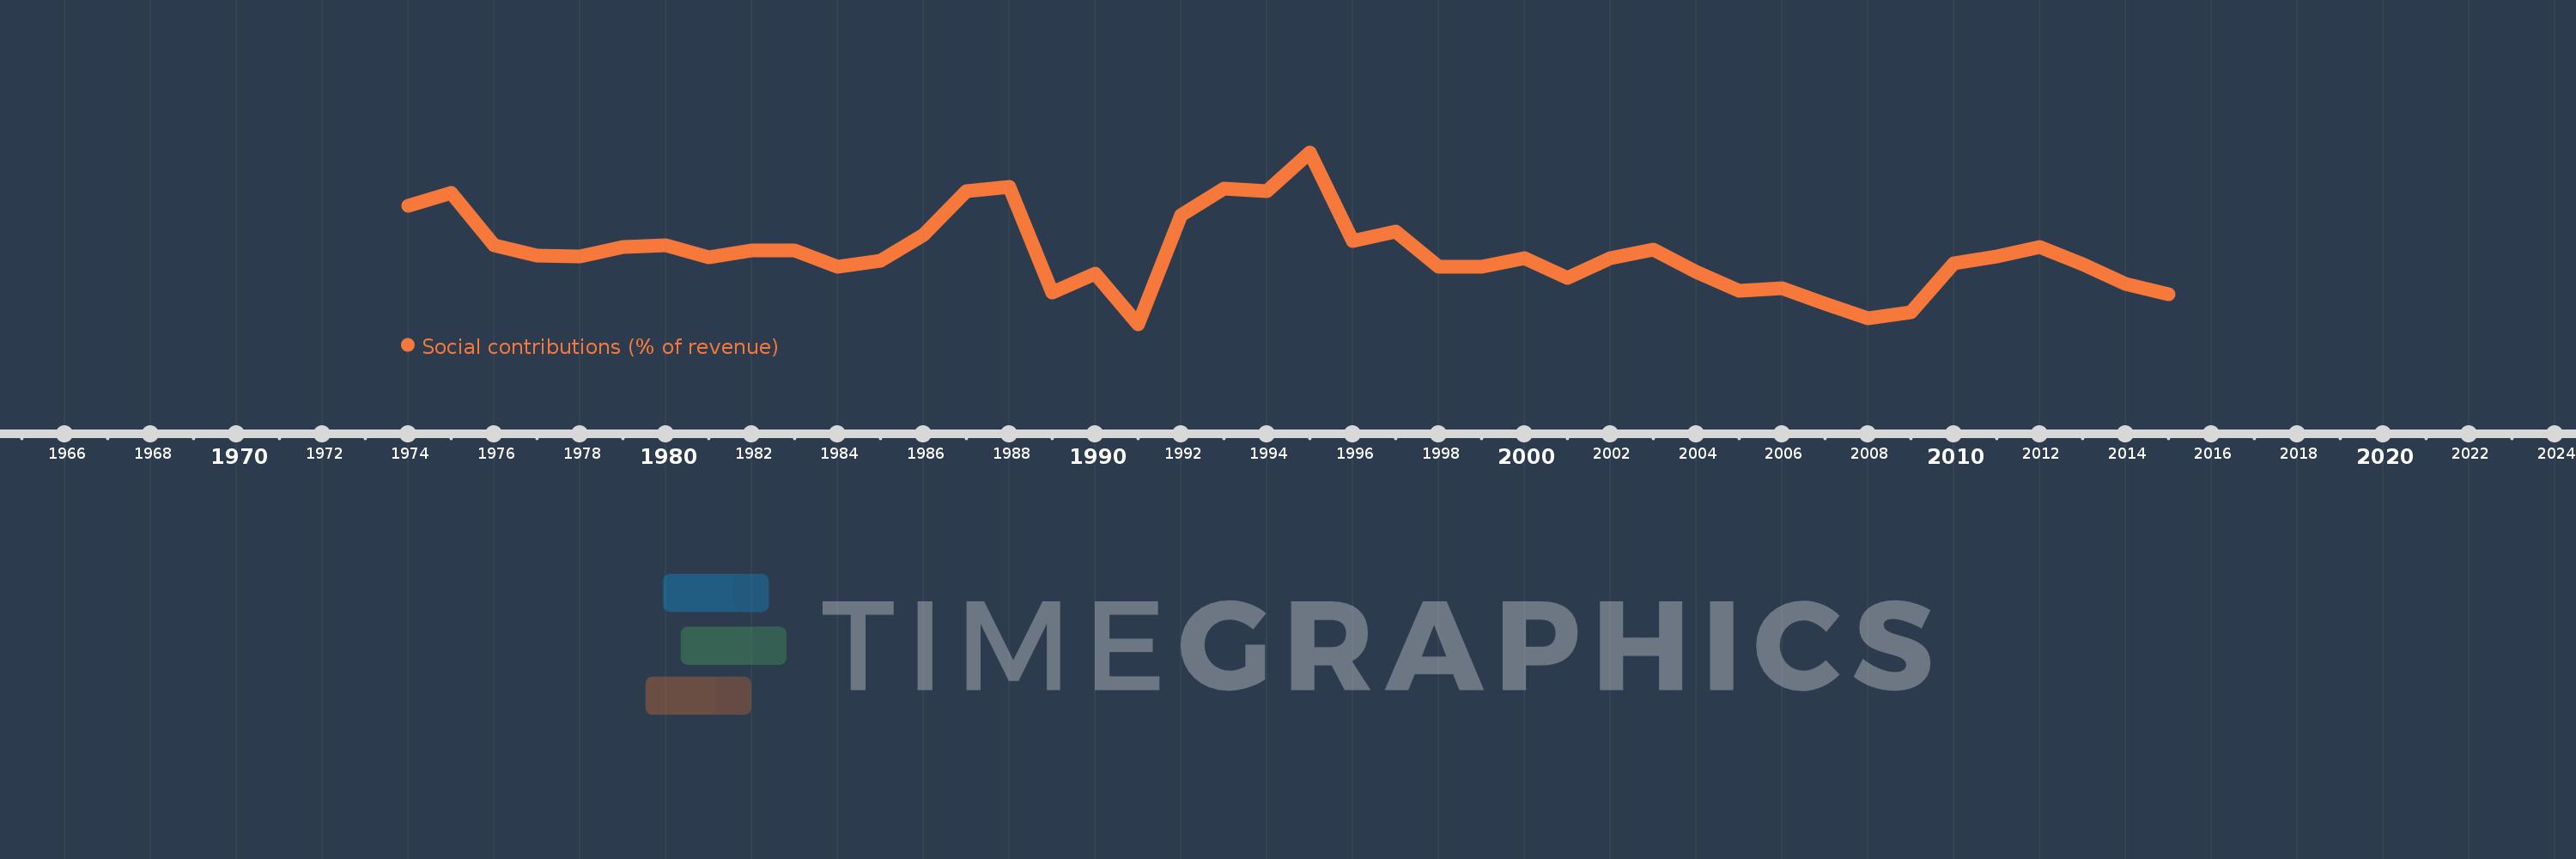
Social contributions (% of revenue)
2015,2014,2013,2012,2011,2010,2009,2008,2007,2006,2005,2004,2003,2002,2001,2000,1999,1998,1997,1996,1995,1994,1993,1992,1991,1990,1989,1988,1987,1986,1985,1984,1983,1982,1981,1980,1979,1978,1977,1976,1975,1974
This statistics in other country:
Timeline:
This timeline shows a graph from 1974 to 2015 of Euro area. No data until 1973. Number of actual observations by date: 42.
Source name:
World Development Indicators
Source organization:
International Monetary Fund, Government Finance Statistics Yearbook and data files.
Categories, topics:
Public Sector
Last updated:
apr 23, 2017
Indicators value changes by year
Minimum:
31.453
jan 1, 1991
Maximum:
38.767
jan 1, 1995
At the date of observation
Value
Absolute change
Change from previous value
jan 1, 1974
36.506
+36.506
0.0%
jan 1, 1975
37.049
+0.543
1.49%
jan 1, 1976
34.806
-2.243
-6.05%
jan 1, 1977
34.392
-0.414
-1.19%
jan 1, 1978
34.323
-0.069
-0.2%
jan 1, 1979
34.745
+0.422
1.23%
jan 1, 1980
34.816
+0.071
0.2%
jan 1, 1981
34.297
-0.519
-1.49%
jan 1, 1982
34.583
+0.285
0.83%
jan 1, 1983
34.607
+0.024
0.07%
jan 1, 1984
33.904
-0.703
-2.03%
jan 1, 1985
34.141
+0.237
0.7%
jan 1, 1986
35.265
+1.124
3.29%
jan 1, 1987
37.129
+1.864
5.28%
jan 1, 1988
37.287
+0.158
0.43%
jan 1, 1989
32.8
-4.487
-12.03%
jan 1, 1990
33.598
+0.798
2.43%
jan 1, 1991
31.453
-2.145
-6.38%
jan 1, 1992
36.091
+4.638
14.75%
jan 1, 1993
37.241
+1.15
3.19%
jan 1, 1994
37.129
-0.112
-0.3%
jan 1, 1995
38.767
+1.638
4.41%
jan 1, 1996
35.013
-3.754
-9.68%
jan 1, 1997
35.402
+0.388
1.11%
jan 1, 1998
33.906
-1.495
-4.22%
jan 1, 1999
33.9
-0.006
-0.02%
jan 1, 2000
34.252
+0.352
1.04%
jan 1, 2001
33.439
-0.814
-2.38%
jan 1, 2002
34.266
+0.828
2.48%
jan 1, 2003
34.618
+0.352
1.03%
jan 1, 2004
33.693
-0.926
-2.67%
jan 1, 2005
32.876
-0.816
-2.42%
jan 1, 2006
32.972
+0.096
0.29%
jan 1, 2007
32.336
-0.636
-1.93%
jan 1, 2008
31.711
-0.625
-1.93%
jan 1, 2009
31.953
+0.242
0.76%
jan 1, 2010
34.057
+2.103
6.58%
jan 1, 2011
34.356
+0.299
0.88%
jan 1, 2012
34.739
+0.383
1.11%
jan 1, 2013
34.021
-0.718
-2.07%
jan 1, 2014
33.167
-0.853
-2.51%
jan 1, 2015
32.738
-0.43
-1.3%
Ranking of countries by current statistics by years


Comments: