29
/
en
AIzaSyAYiBZKx7MnpbEhh9jyipgxe19OcubqV5w
April 1, 2024
258993
Syrian Arab Republic
SYR
true
2
1
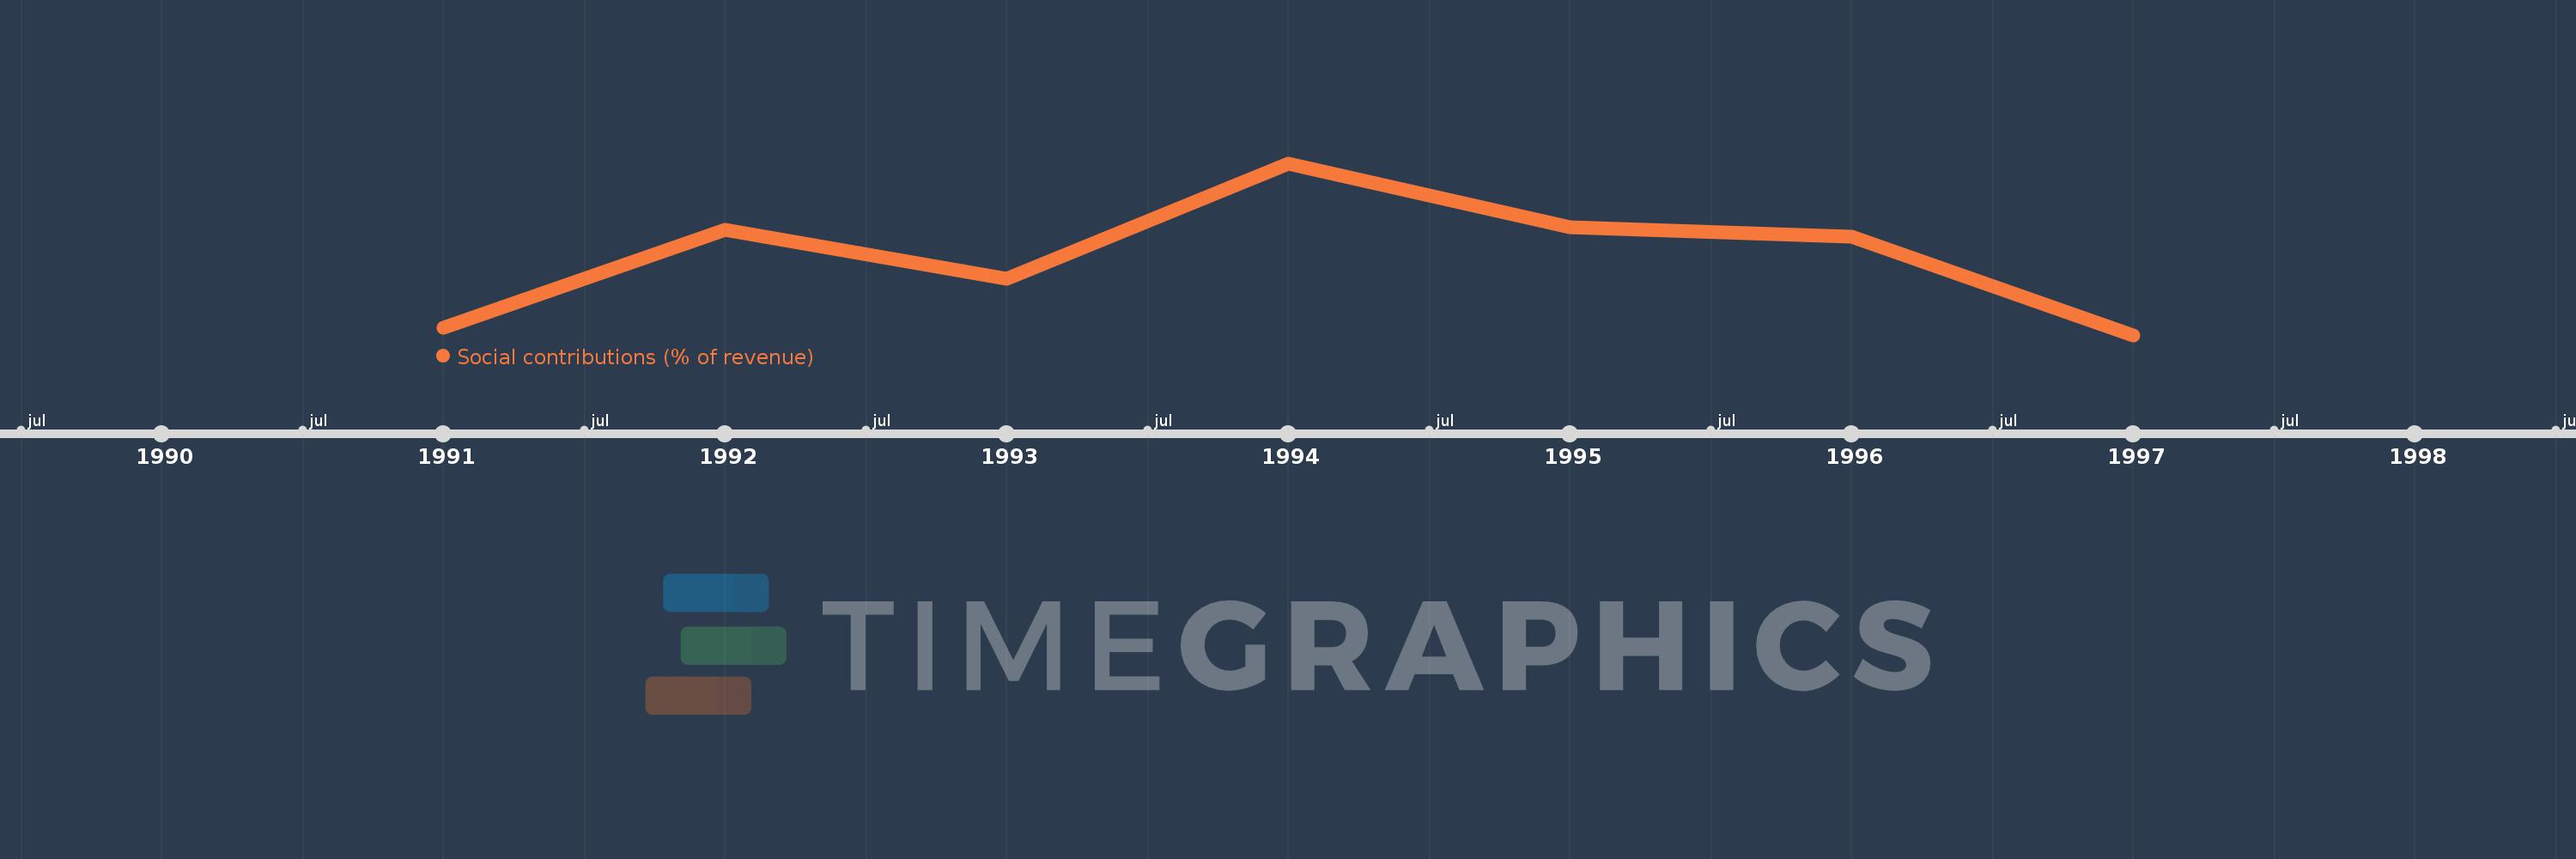
Social contributions (% of revenue)
1997,1996,1995,1994,1993,1992,1991
This statistics in other country:
Timeline:
This timeline shows a graph from 1991 to 1997 of Syrian Arab Republic. No data until 1990. Number of actual observations by date: 7.
Source name:
World Development Indicators
Source organization:
International Monetary Fund, Government Finance Statistics Yearbook and data files.
Categories, topics:
Public Sector
Last updated:
apr 23, 2017
Indicators value changes by year
At the date of observation
Value
Absolute change
Change from previous value
jan 1, 1991
0.278
+0.278
0.0%
jan 1, 1992
0.373
+0.095
34.29%
jan 1, 1993
0.325
-0.048
-12.91%
jan 1, 1994
0.437
+0.112
34.43%
jan 1, 1995
0.375
-0.062
-14.2%
jan 1, 1996
0.366
-0.009
-2.27%
jan 1, 1997
0.271
-0.095
-26.06%
Ranking of countries by current statistics by years


Comments: