29
/
en
AIzaSyAYiBZKx7MnpbEhh9jyipgxe19OcubqV5w
April 1, 2024
257810
Switzerland
CHE
true
2
1
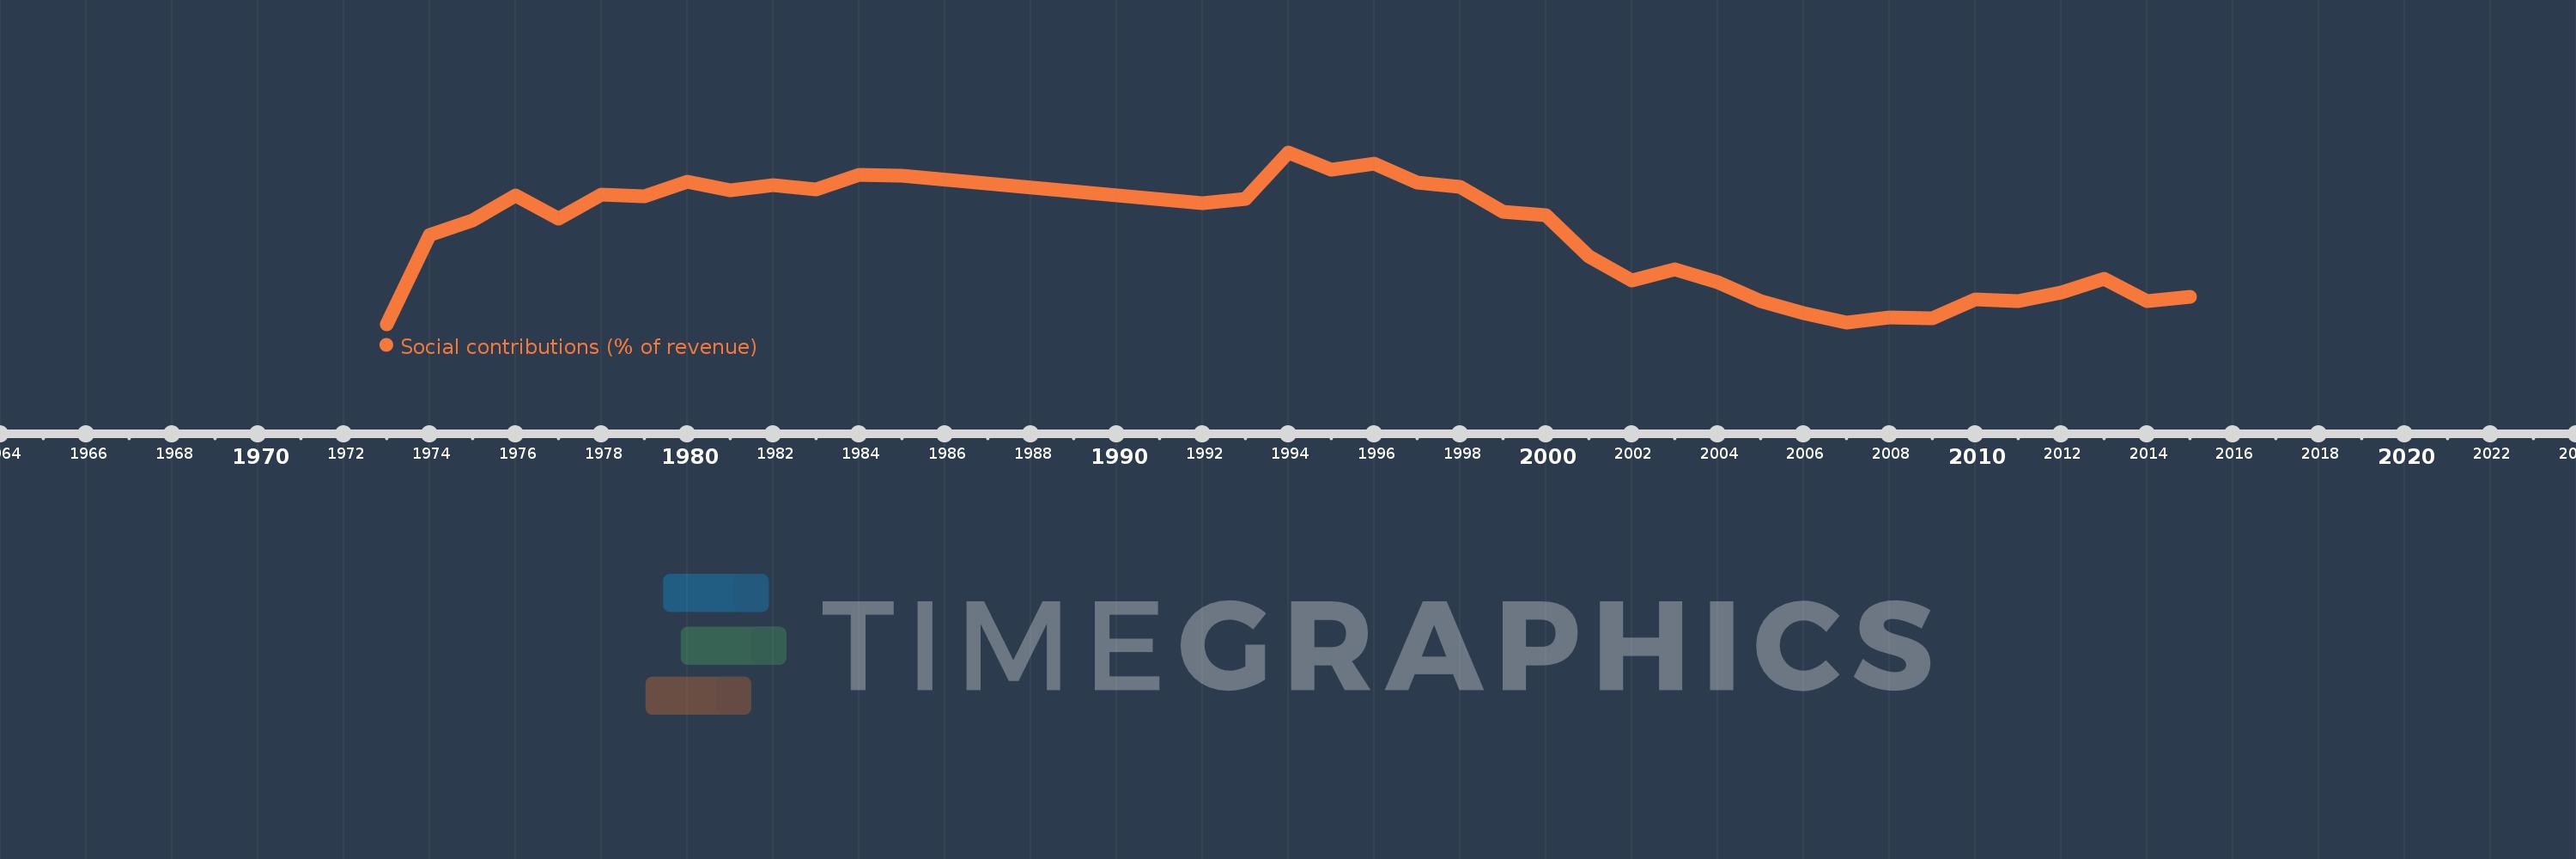
Social contributions (% of revenue)
2015,2014,2013,2012,2011,2010,2009,2008,2007,2006,2005,2004,2003,2002,2001,2000,1999,1998,1997,1996,1995,1994,1993,1992,1985,1984,1983,1982,1981,1980,1979,1978,1977,1976,1975,1974,1973
This statistics in other country:
Timeline:
This timeline shows a graph from 1973 to 2015 of Switzerland. No data until 1972. Number of actual observations by date: 37.
Source name:
World Development Indicators
Source organization:
International Monetary Fund, Government Finance Statistics Yearbook and data files.
Categories, topics:
Public Sector
Last updated:
apr 23, 2017
Indicators value changes by year
Minimum:
36.351
jan 1, 1973
Maximum:
49.372
jan 1, 1994
At the date of observation
Value
Absolute change
Change from previous value
jan 1, 1973
36.351
+36.351
0.0%
jan 1, 1974
43.109
+6.758
18.59%
jan 1, 1975
44.23
+1.12
2.6%
jan 1, 1976
46.111
+1.882
4.25%
jan 1, 1977
44.327
-1.784
-3.87%
jan 1, 1978
46.168
+1.841
4.15%
jan 1, 1979
46.064
-0.104
-0.22%
jan 1, 1980
47.158
+1.094
2.37%
jan 1, 1981
46.49
-0.669
-1.42%
jan 1, 1982
46.875
+0.385
0.83%
jan 1, 1983
46.57
-0.305
-0.65%
jan 1, 1984
47.646
+1.076
2.31%
jan 1, 1985
47.635
-0.011
-0.02%
jan 1, 1992
45.492
-2.143
-4.5%
jan 1, 1993
45.82
+0.328
0.72%
jan 1, 1994
49.372
+3.552
7.75%
jan 1, 1995
48.051
-1.322
-2.68%
jan 1, 1996
48.51
+0.46
0.96%
jan 1, 1997
47.071
-1.439
-2.97%
jan 1, 1998
46.738
-0.333
-0.71%
jan 1, 1999
44.89
-1.848
-3.95%
jan 1, 2000
44.597
-0.293
-0.65%
jan 1, 2001
41.48
-3.117
-6.99%
jan 1, 2002
39.633
-1.847
-4.45%
jan 1, 2003
40.529
+0.896
2.26%
jan 1, 2004
39.547
-0.982
-2.42%
jan 1, 2005
38.097
-1.45
-3.67%
jan 1, 2006
37.219
-0.877
-2.3%
jan 1, 2007
36.455
-0.764
-2.05%
jan 1, 2008
36.868
+0.412
1.13%
jan 1, 2009
36.797
-0.071
-0.19%
jan 1, 2010
38.256
+1.459
3.96%
jan 1, 2011
38.1
-0.156
-0.41%
jan 1, 2012
38.748
+0.648
1.7%
jan 1, 2013
39.775
+1.027
2.65%
jan 1, 2014
38.089
-1.685
-4.24%
jan 1, 2015
38.415
+0.325
0.85%
Ranking of countries by current statistics by years


Comments: