29
/
en
AIzaSyAYiBZKx7MnpbEhh9jyipgxe19OcubqV5w
April 1, 2024
117429
Cyprus
CYP
true
2
1
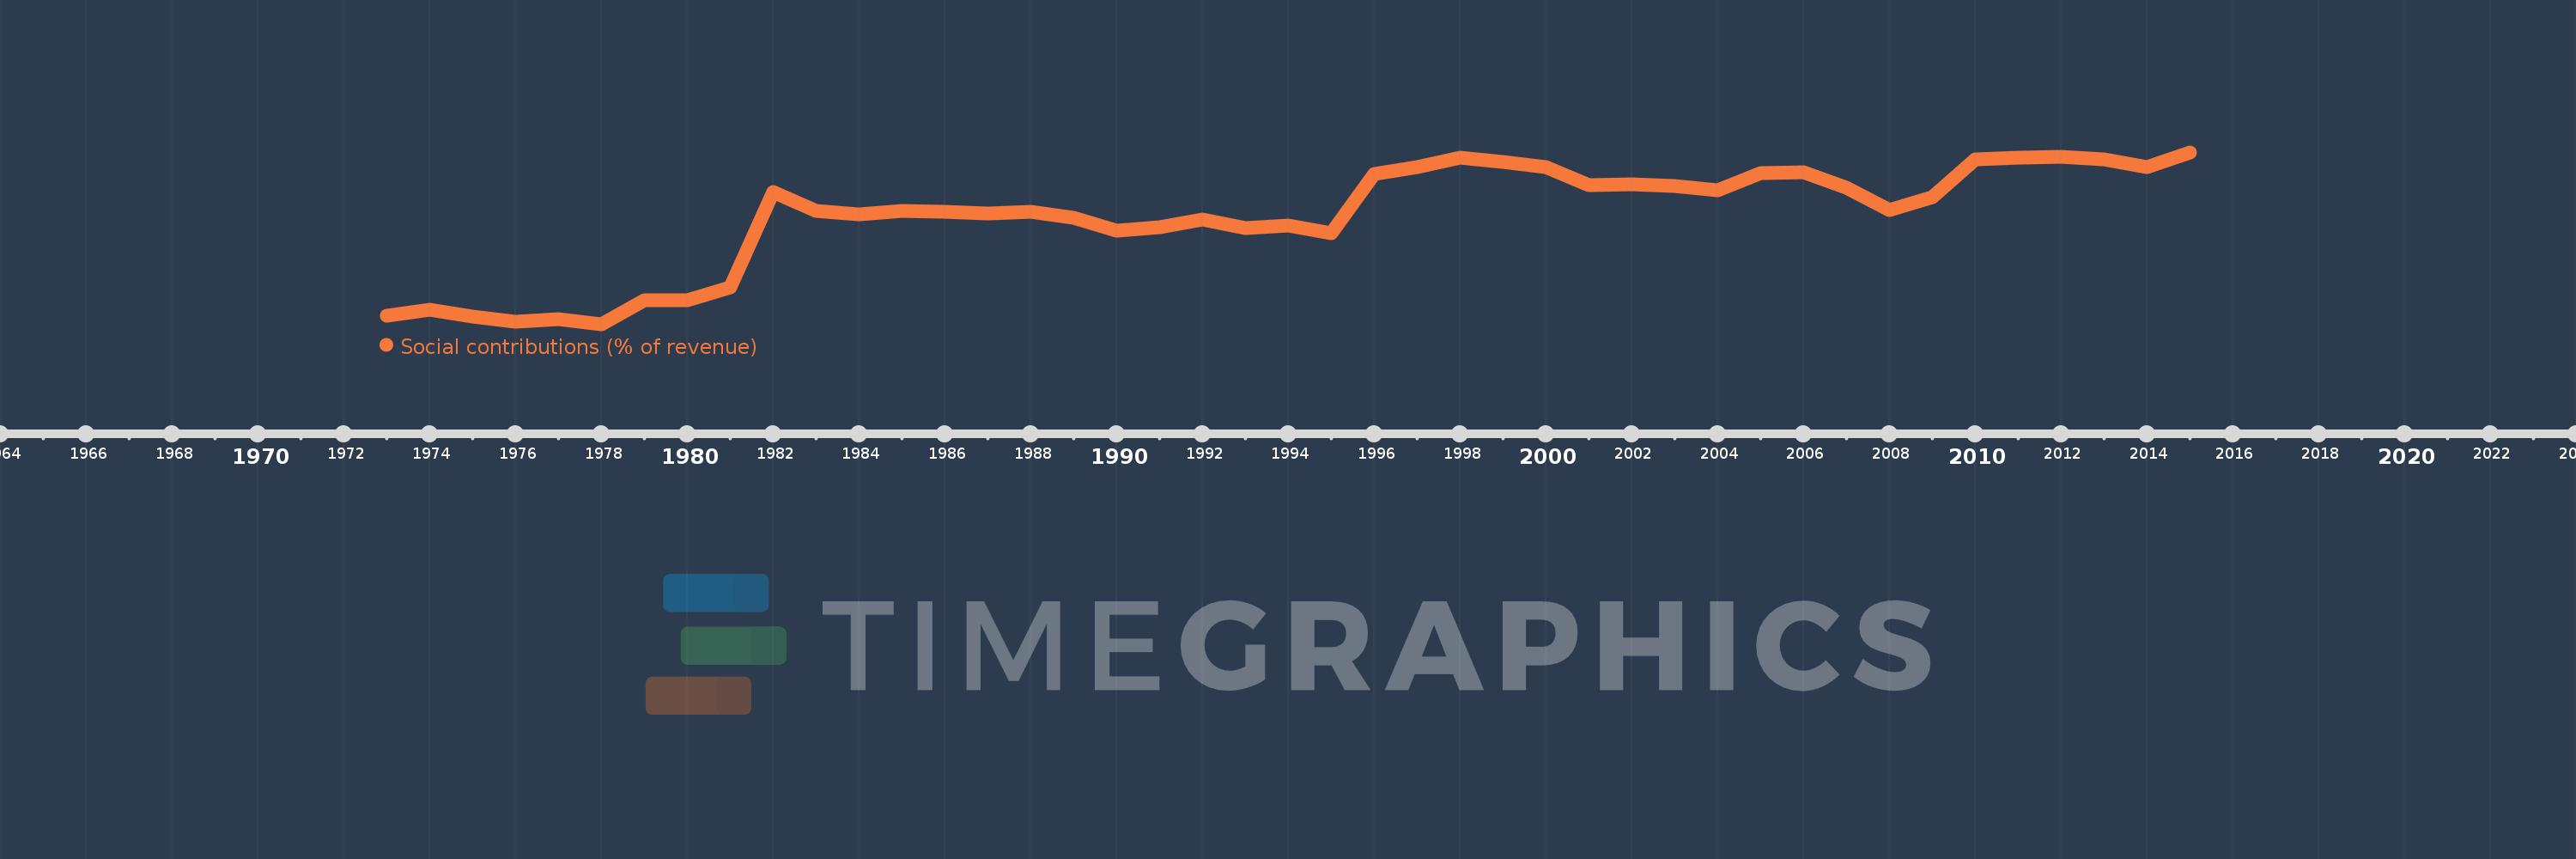
Social contributions (% of revenue)
2015,2014,2013,2012,2011,2010,2009,2008,2007,2006,2005,2004,2003,2002,2001,2000,1999,1998,1997,1996,1995,1994,1993,1992,1991,1990,1989,1988,1987,1986,1985,1984,1983,1982,1981,1980,1979,1978,1977,1976,1975,1974,1973
This statistics in other country:
Timeline:
This timeline shows a graph from 1973 to 2015 of Cyprus. No data until 1972. Number of actual observations by date: 43.
Source name:
World Development Indicators
Source organization:
International Monetary Fund, Government Finance Statistics Yearbook and data files.
Categories, topics:
Public Sector
Last updated:
apr 23, 2017
Indicators value changes by year
Maximum:
22.685
jan 1, 2015
At the date of observation
Value
Absolute change
Change from previous value
jan 1, 1973
7.068
+7.068
0.0%
jan 1, 1974
7.644
+0.576
8.15%
jan 1, 1975
6.954
-0.69
-9.03%
jan 1, 1976
6.435
-0.518
-7.45%
jan 1, 1977
6.658
+0.223
3.47%
jan 1, 1978
6.213
-0.446
-6.69%
jan 1, 1979
8.543
+2.33
37.51%
jan 1, 1980
8.515
-0.028
-0.33%
jan 1, 1981
9.733
+1.218
14.31%
jan 1, 1982
18.851
+9.118
93.68%
jan 1, 1983
17.059
-1.793
-9.51%
jan 1, 1984
16.75
-0.309
-1.81%
jan 1, 1985
17.072
+0.322
1.92%
jan 1, 1986
16.998
-0.074
-0.43%
jan 1, 1987
16.862
-0.136
-0.8%
jan 1, 1988
17.004
+0.142
0.84%
jan 1, 1989
16.392
-0.613
-3.6%
jan 1, 1990
15.221
-1.171
-7.14%
jan 1, 1991
15.493
+0.272
1.79%
jan 1, 1992
16.289
+0.795
5.13%
jan 1, 1993
15.41
-0.878
-5.39%
jan 1, 1994
15.695
+0.285
1.85%
jan 1, 1995
14.975
-0.72
-4.59%
jan 1, 1996
20.624
+5.649
37.73%
jan 1, 1997
21.315
+0.691
3.35%
jan 1, 1998
22.163
+0.847
3.98%
jan 1, 1999
21.788
-0.374
-1.69%
jan 1, 2000
21.282
-0.506
-2.32%
jan 1, 2001
19.566
-1.716
-8.06%
jan 1, 2002
19.603
+0.037
0.19%
jan 1, 2003
19.456
-0.147
-0.75%
jan 1, 2004
19.079
-0.377
-1.94%
jan 1, 2005
20.733
+1.654
8.67%
jan 1, 2006
20.759
+0.026
0.12%
jan 1, 2007
19.276
-1.483
-7.14%
jan 1, 2008
17.191
-2.085
-10.82%
jan 1, 2009
18.358
+1.167
6.79%
jan 1, 2010
22.041
+3.683
20.06%
jan 1, 2011
22.206
+0.165
0.75%
jan 1, 2012
22.304
+0.098
0.44%
jan 1, 2013
22.006
-0.297
-1.33%
jan 1, 2014
21.25
-0.756
-3.44%
jan 1, 2015
22.685
+1.435
6.75%
Ranking of countries by current statistics by years


Comments: