29
/
en
AIzaSyAYiBZKx7MnpbEhh9jyipgxe19OcubqV5w
April 1, 2024
41931
Latin America & Caribbean
LCN
false
2
1
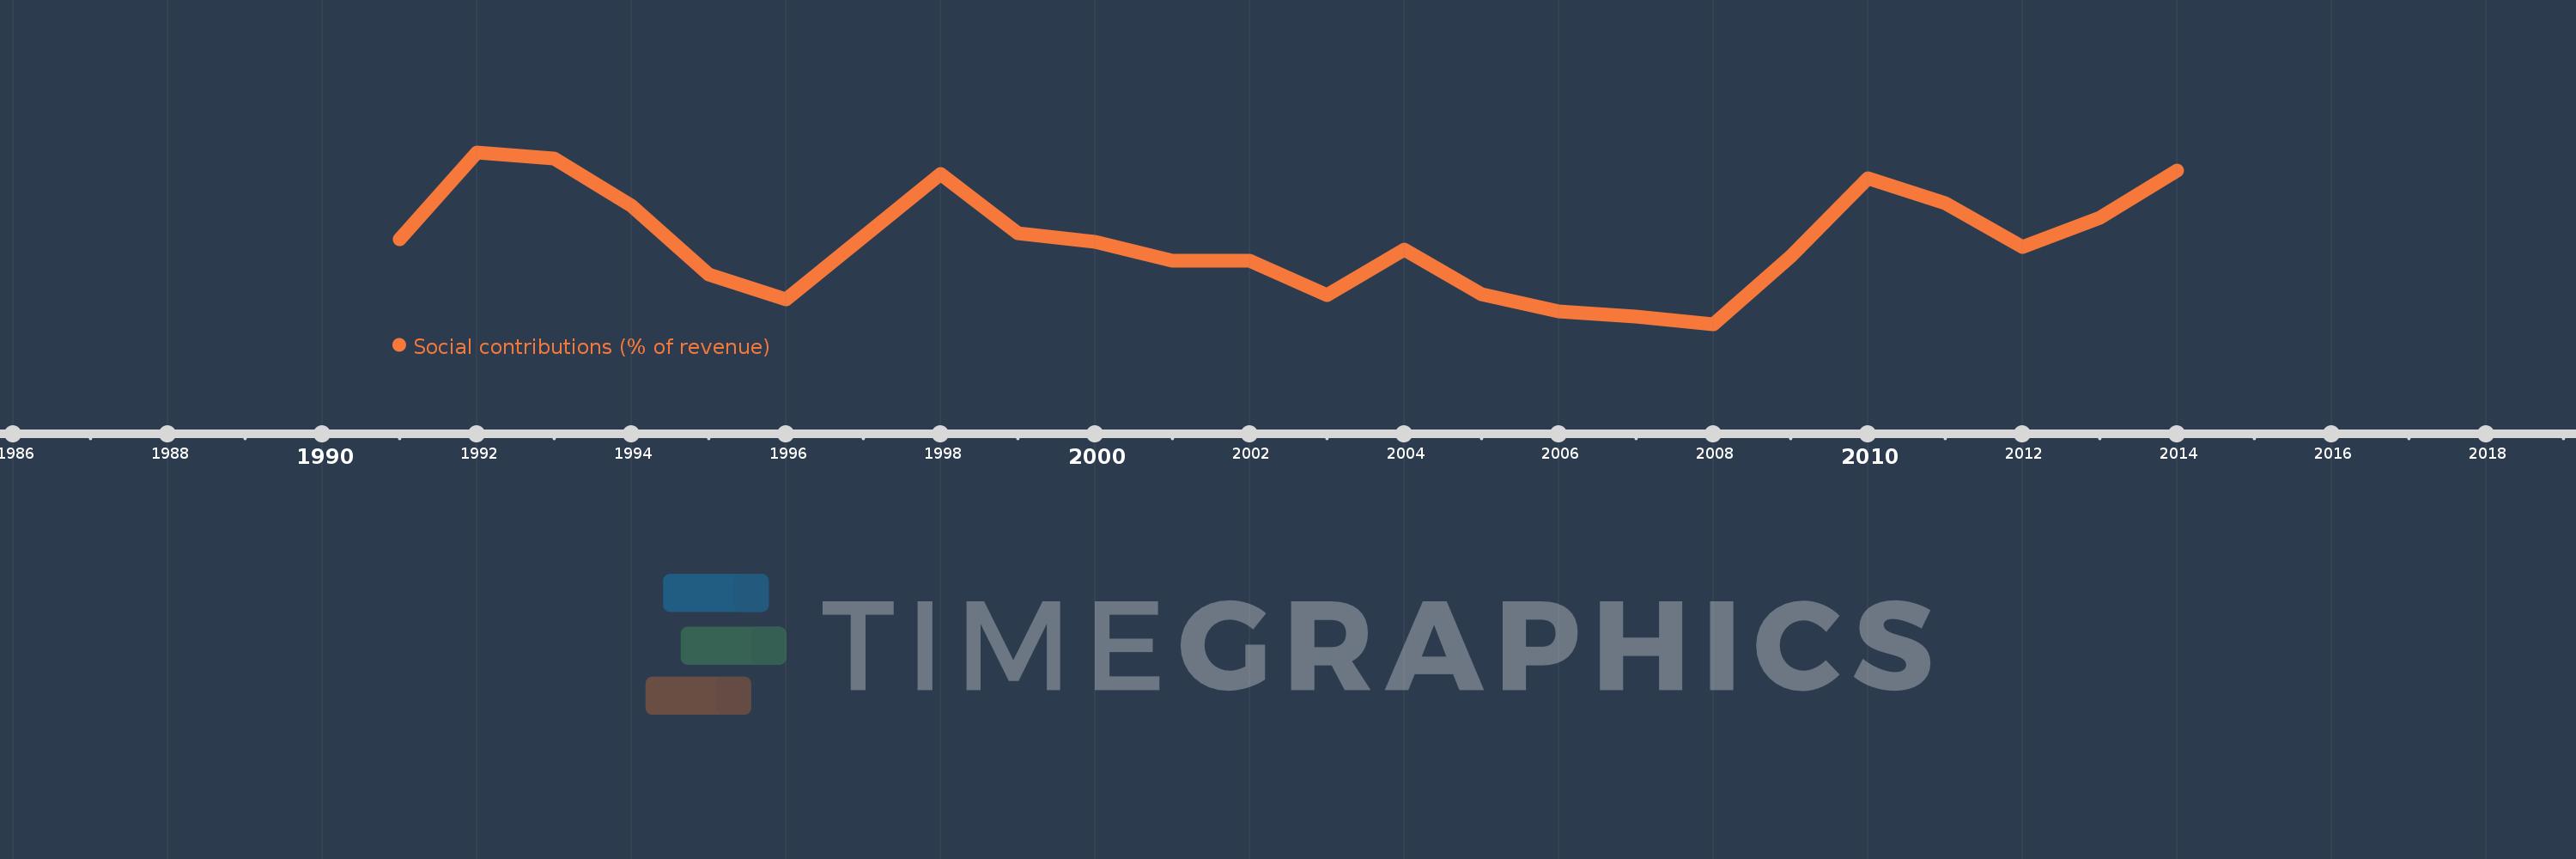
Social contributions (% of revenue)
2014,2013,2012,2011,2010,2009,2008,2007,2006,2005,2004,2003,2002,2001,2000,1999,1998,1996,1995,1994,1993,1992,1991
This statistics in other country:
Timeline:
This timeline shows a graph from 1991 to 2014 of Latin America & Caribbean . No data until 1990. Number of actual observations by date: 23.
Source name:
World Development Indicators
Source organization:
International Monetary Fund, Government Finance Statistics Yearbook and data files.
Categories, topics:
Public Sector
Last updated:
apr 23, 2017
Indicators value changes by year
Maximum:
13.285
jan 1, 1992
At the date of observation
Value
Absolute change
Change from previous value
jan 1, 1991
10.466
+10.466
0.0%
jan 1, 1992
13.285
+2.819
26.94%
jan 1, 1993
13.09
-0.194
-1.46%
jan 1, 1994
11.549
-1.541
-11.77%
jan 1, 1995
9.317
-2.232
-19.33%
jan 1, 1996
8.528
-0.789
-8.47%
jan 1, 1998
12.585
+4.057
47.57%
jan 1, 1999
10.657
-1.927
-15.32%
jan 1, 2000
10.396
-0.262
-2.45%
jan 1, 2001
9.764
-0.632
-6.08%
jan 1, 2002
9.758
-0.006
-0.06%
jan 1, 2003
8.666
-1.092
-11.19%
jan 1, 2004
10.132
+1.466
16.91%
jan 1, 2005
8.671
-1.461
-14.42%
jan 1, 2006
8.128
-0.543
-6.26%
jan 1, 2007
7.962
-0.167
-2.05%
jan 1, 2008
7.711
-0.251
-3.15%
jan 1, 2009
9.903
+2.192
28.43%
jan 1, 2010
12.448
+2.545
25.7%
jan 1, 2011
11.642
-0.806
-6.48%
jan 1, 2012
10.206
-1.436
-12.33%
jan 1, 2013
11.165
+0.958
9.39%
jan 1, 2014
12.704
+1.539
13.79%
Ranking of countries by current statistics by years


Comments: