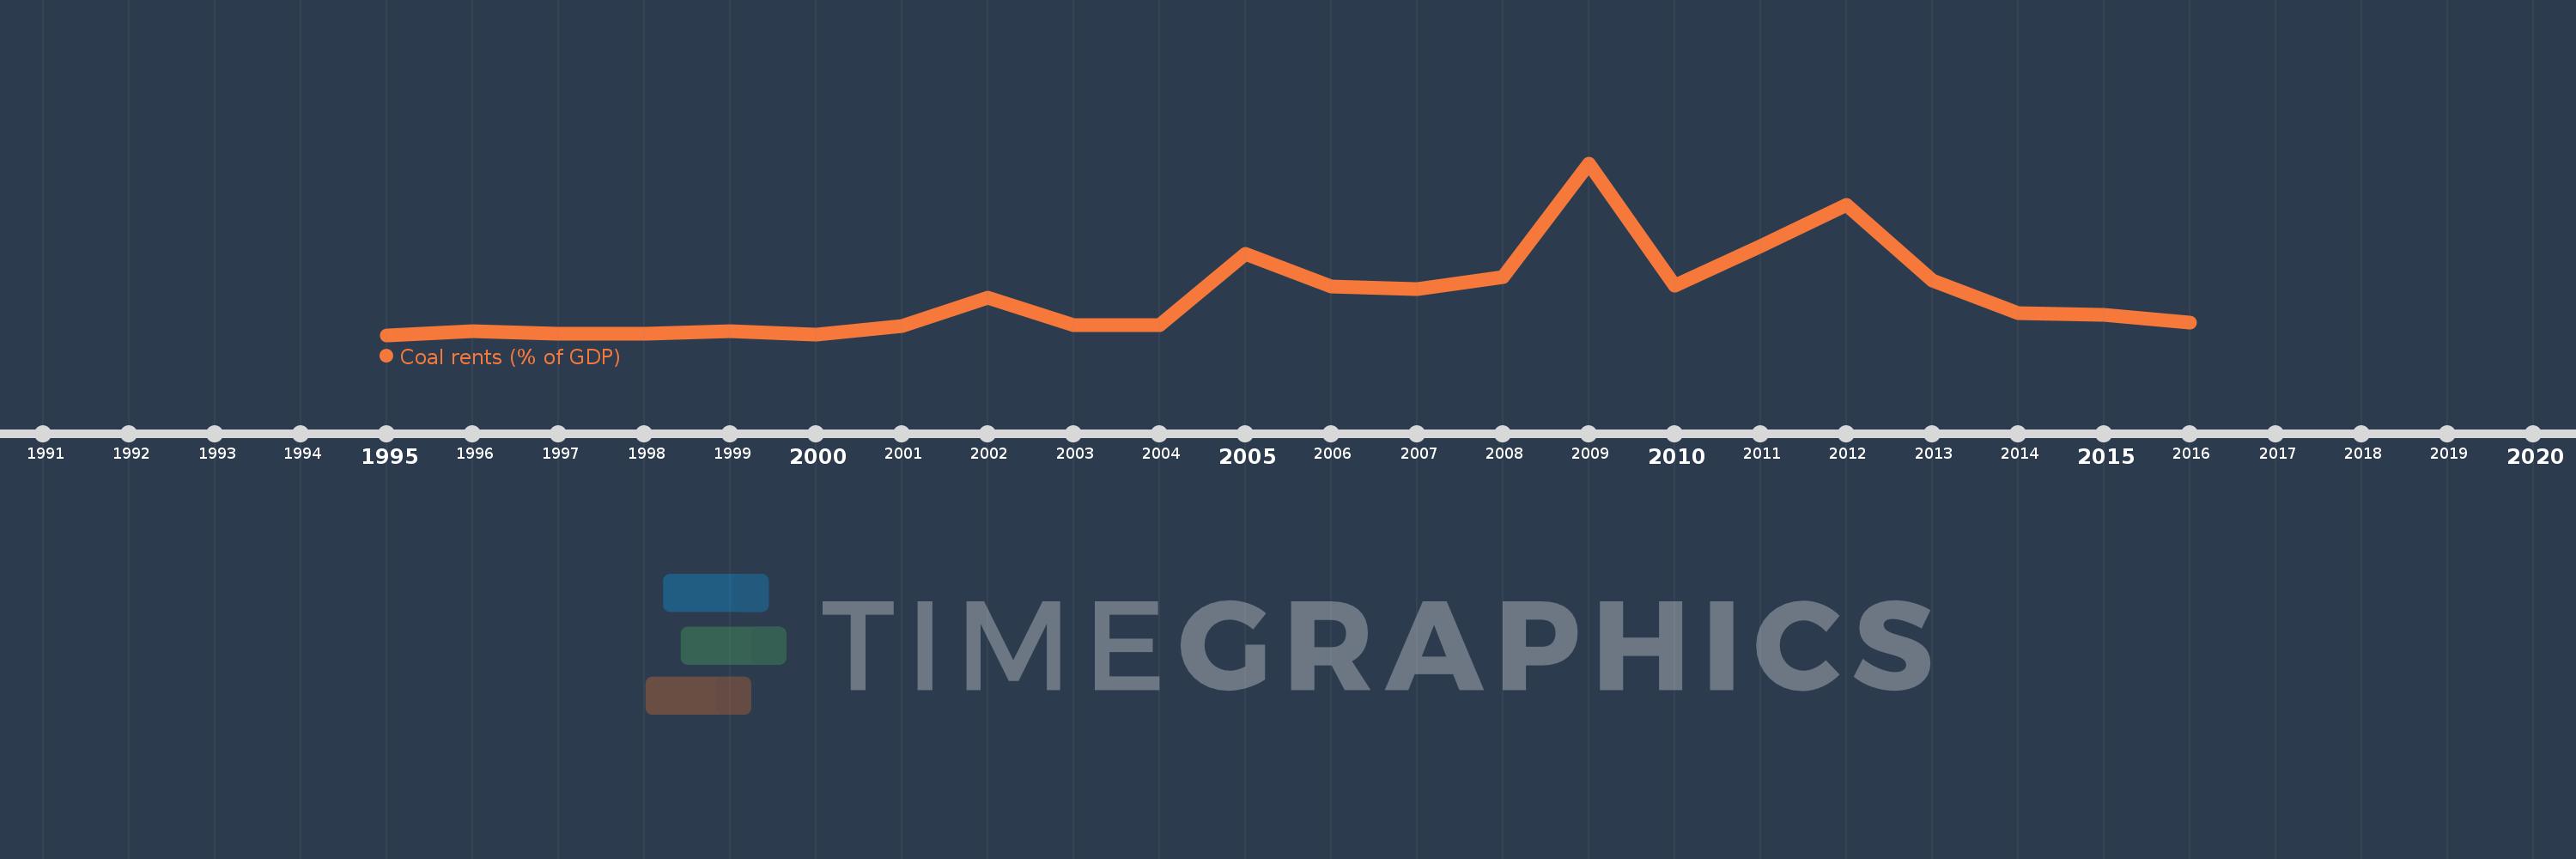
This timeline shows a graph from 1995 to 2016 of Bosnia and Herzegovina. No data until 1994. Number of actual observations by date: 22.
Source name:
World Development Indicators
Source organization:
Estimates based on sources and methods described in "The Changing Wealth of Nations: Measuring Sustainable Development in the New Millennium" (World Bank, 2011).
Categories, topics:
Environment
Last updated:
apr 23, 2017
Indicators value changes by year
Meaning:
0.541
Minimum:
0.013
jan 1, 1995
Maximum:
2.335
jan 1, 2009
At the date of observation
Value
Absolute change
Change from the previous value
jan 1, 1995
0.013
+0.013
0.0%
jan 1, 1996
0.062
+0.049
389.81%
jan 1, 1997
0.03
-0.032
-50.82%
jan 1, 1998
0.029
-0.001
-3.35%
jan 1, 1999
0.063
+0.034
115.35%
jan 1, 2000
0.014
-0.049
-77.94%
jan 1, 2001
0.14
+0.126
902.3%
jan 1, 2002
0.52
+0.38
270.87%
jan 1, 2003
0.147
-0.374
-71.79%
jan 1, 2004
0.152
+0.005
3.26%
jan 1, 2005
1.109
+0.957
631.23%
jan 1, 2006
0.668
-0.441
-39.78%
jan 1, 2007
0.634
-0.033
-4.99%
jan 1, 2008
0.792
+0.158
24.84%
jan 1, 2009
2.335
+1.543
194.89%
jan 1, 2010
0.684
-1.651
-70.69%
jan 1, 2011
1.21
+0.526
76.9%
jan 1, 2012
1.768
+0.558
46.1%
jan 1, 2013
0.753
-1.016
-57.44%
jan 1, 2014
0.311
-0.442
-58.68%
jan 1, 2015
0.283
-0.028
-8.94%
jan 1, 2016
0.187
-0.096
-34.01%
Ranking of countries by current statistics by years