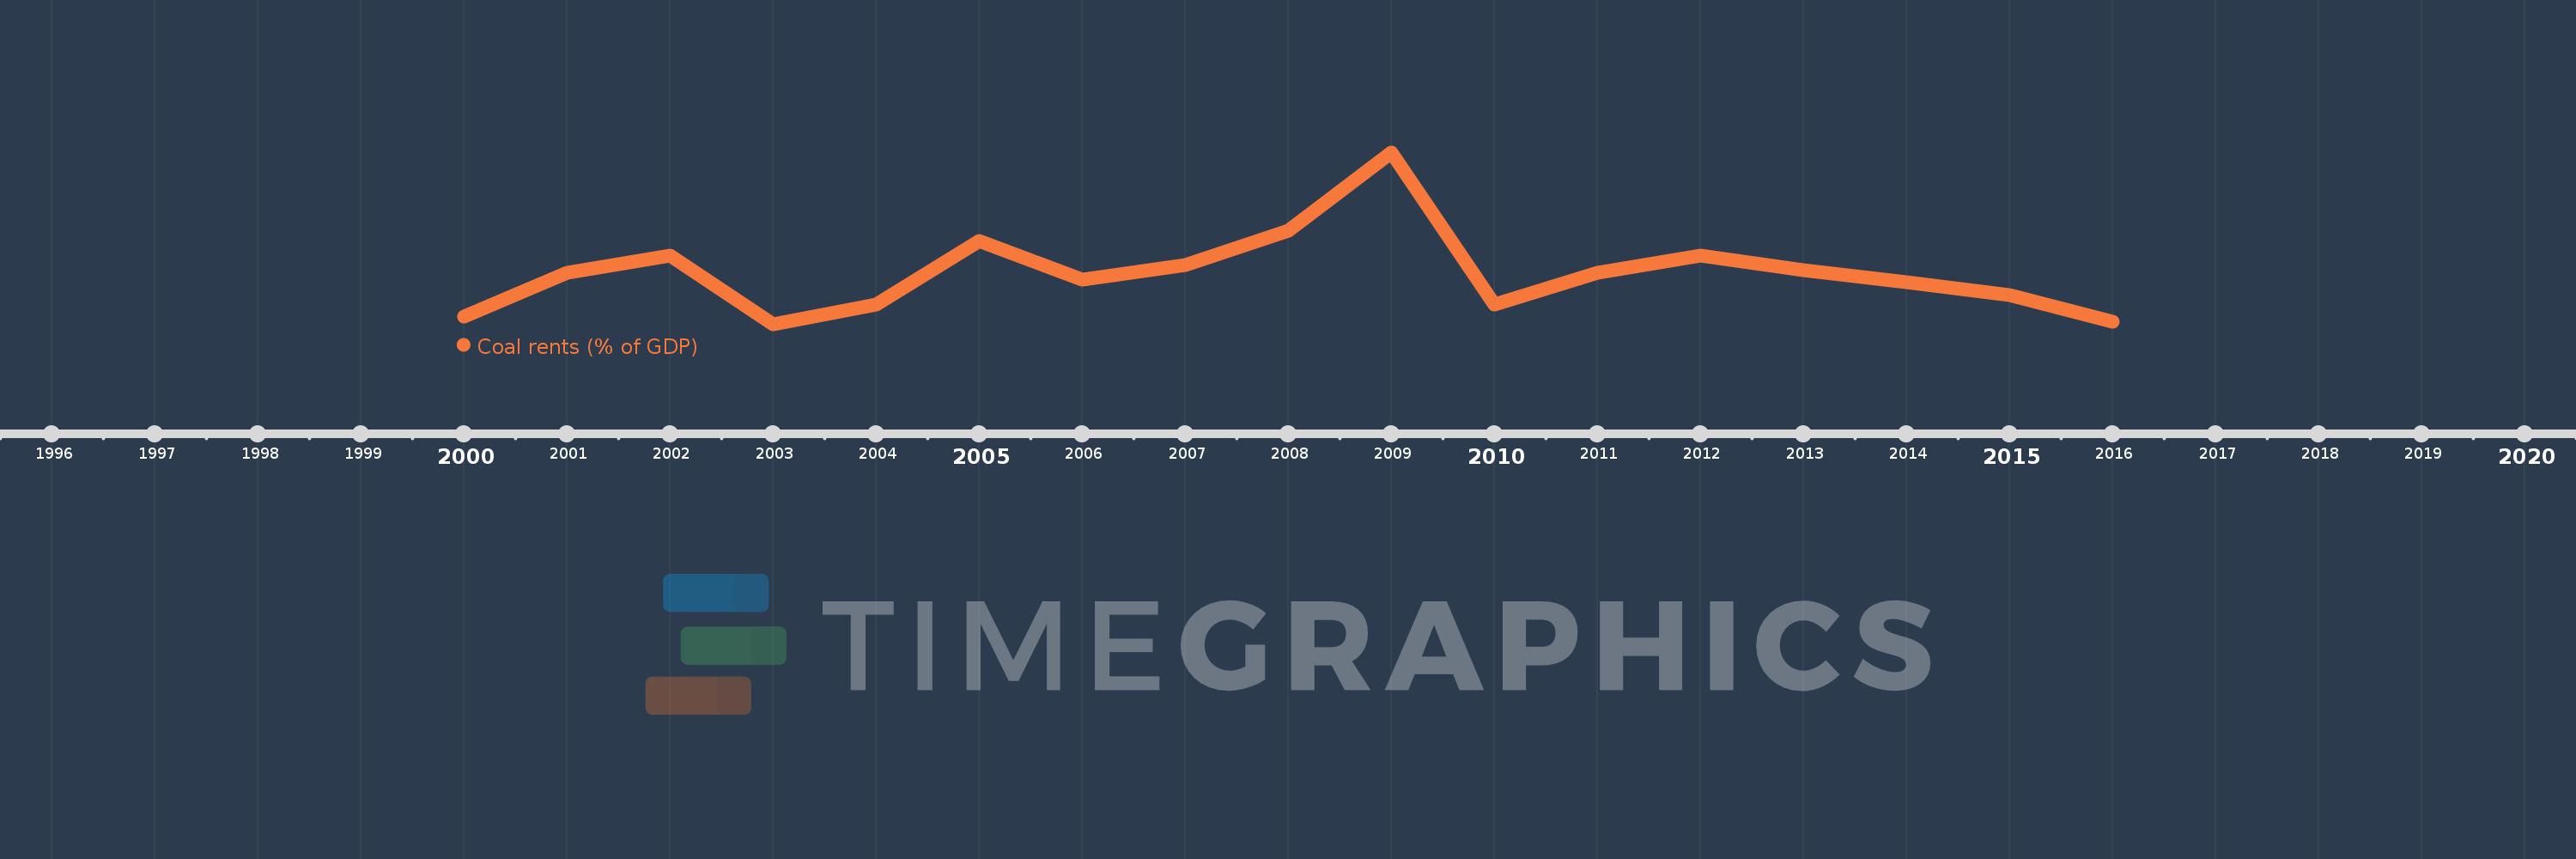
This timeline shows a graph from 2000 to 2016 of Malawi. No data until 1999. Number of actual observations by date: 17.
Source name:
World Development Indicators
Source organization:
Estimates based on sources and methods described in "The Changing Wealth of Nations: Measuring Sustainable Development in the New Millennium" (World Bank, 2011).
Categories, topics:
Environment
Last updated:
apr 23, 2017
Indicators value changes by year
Meaning:
0.038
Minimum:
0.017
jan 1, 2003
Maximum:
0.087
jan 1, 2009
At the date of observation
Value
Absolute change
Change from the previous value
jan 1, 2000
0.02
+0.02
0.0%
jan 1, 2001
0.038
+0.018
91.01%
jan 1, 2002
0.045
+0.006
15.76%
jan 1, 2003
0.017
-0.027
-61.26%
jan 1, 2004
0.025
+0.008
46.66%
jan 1, 2005
0.051
+0.026
101.39%
jan 1, 2006
0.035
-0.016
-32.29%
jan 1, 2007
0.041
+0.006
17.9%
jan 1, 2008
0.055
+0.015
36.18%
jan 1, 2009
0.087
+0.032
57.33%
jan 1, 2010
0.025
-0.063
-71.84%
jan 1, 2011
0.038
+0.013
53.8%
jan 1, 2012
0.045
+0.007
18.34%
jan 1, 2013
0.039
-0.006
-13.33%
jan 1, 2014
0.034
-0.005
-12.6%
jan 1, 2015
0.029
-0.005
-13.38%
jan 1, 2016
0.018
-0.011
-38.91%
Ranking of countries by current statistics by years