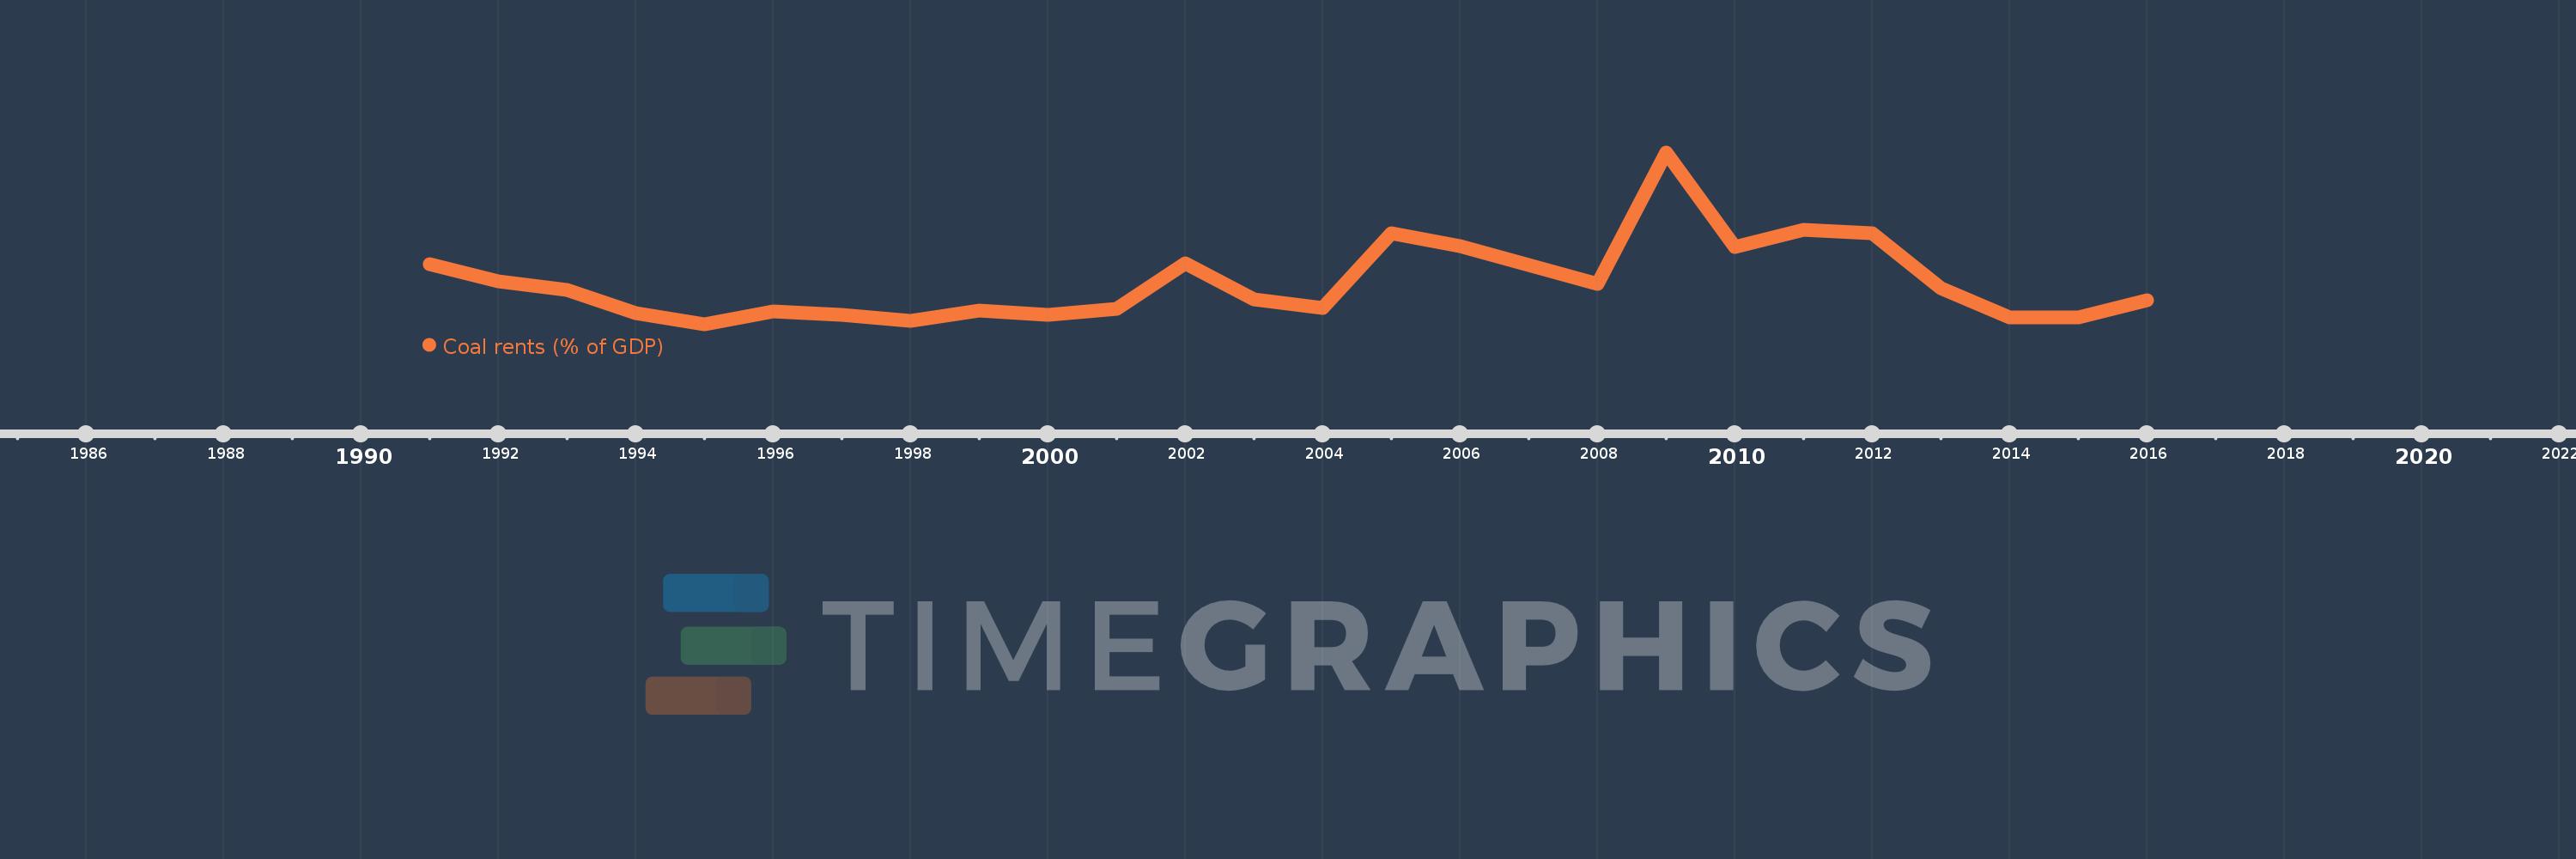
This timeline shows a graph from 1991 to 2016 of Russian Federation. No data until 1990. Number of actual observations by date: 26.
Source name:
World Development Indicators
Source organization:
Estimates based on sources and methods described in "The Changing Wealth of Nations: Measuring Sustainable Development in the New Millennium" (World Bank, 2011).
Categories, topics:
Environment
Last updated:
apr 23, 2017
Indicators value changes by year
Meaning:
0.439
Minimum:
0.142
jan 1, 1995
Maximum:
1.353
jan 1, 2009
At the date of observation
Value
Absolute change
Change from the previous value
jan 1, 1991
0.567
+0.567
0.0%
jan 1, 1992
0.444
-0.123
-21.72%
jan 1, 1993
0.386
-0.058
-13.05%
jan 1, 1994
0.223
-0.163
-42.2%
jan 1, 1995
0.142
-0.082
-36.55%
jan 1, 1996
0.234
+0.093
65.33%
jan 1, 1997
0.21
-0.025
-10.49%
jan 1, 1998
0.163
-0.046
-22.17%
jan 1, 1999
0.236
+0.073
44.56%
jan 1, 2000
0.21
-0.025
-10.8%
jan 1, 2001
0.253
+0.043
20.38%
jan 1, 2002
0.573
+0.32
126.19%
jan 1, 2003
0.32
-0.253
-44.2%
jan 1, 2004
0.257
-0.063
-19.59%
jan 1, 2005
0.783
+0.526
204.61%
jan 1, 2006
0.692
-0.091
-11.58%
jan 1, 2007
0.558
-0.134
-19.33%
jan 1, 2008
0.427
-0.132
-23.57%
jan 1, 2009
1.353
+0.926
216.94%
jan 1, 2010
0.689
-0.664
-49.1%
jan 1, 2011
0.808
+0.12
17.36%
jan 1, 2012
0.784
-0.024
-2.98%
jan 1, 2013
0.396
-0.388
-49.54%
jan 1, 2014
0.191
-0.205
-51.74%
jan 1, 2015
0.192
+0.001
0.43%
jan 1, 2016
0.313
+0.121
63.08%
Ranking of countries by current statistics by years