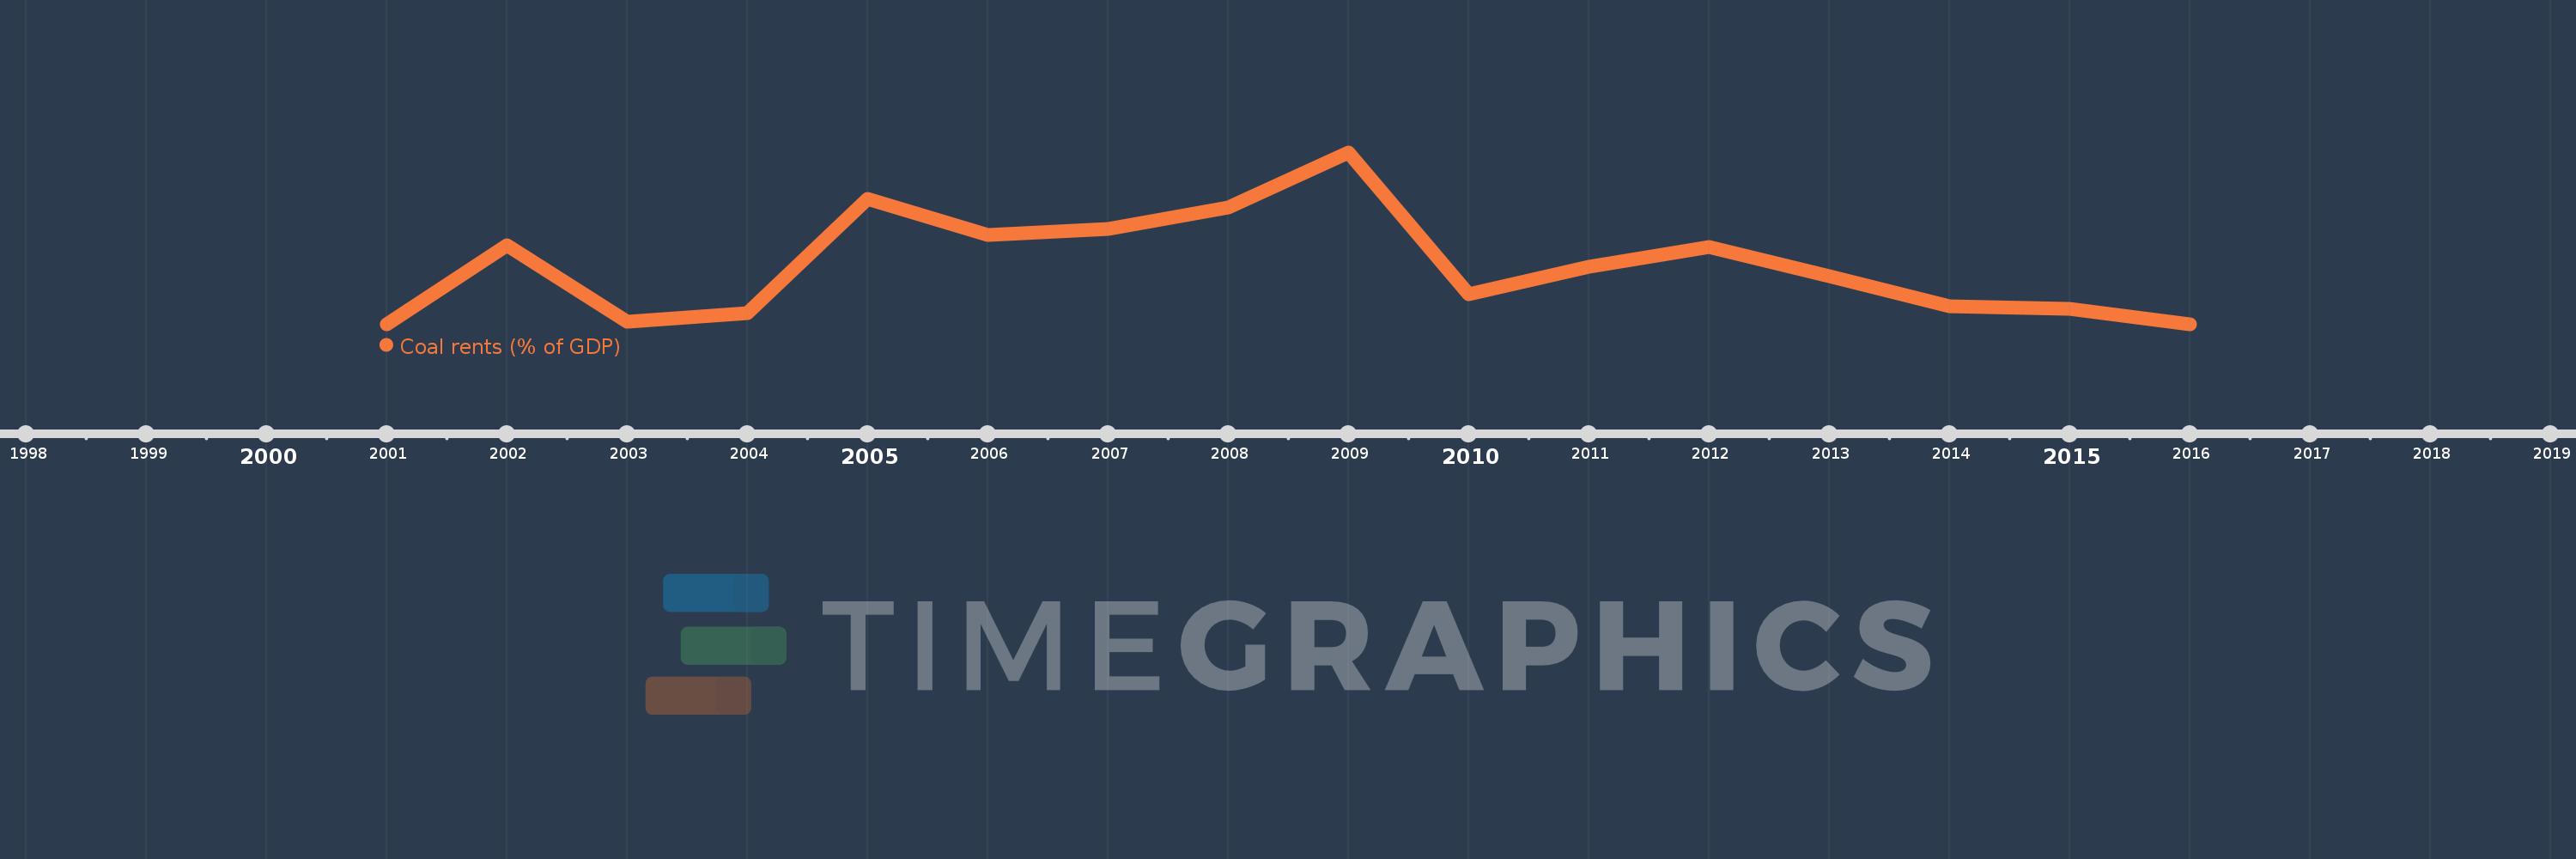
This timeline shows a graph from 2001 to 2016 of Myanmar. No data until 2000. Number of actual observations by date: 16.
Source name:
World Development Indicators
Source organization:
Estimates based on sources and methods described in "The Changing Wealth of Nations: Measuring Sustainable Development in the New Millennium" (World Bank, 2011).
Categories, topics:
Environment
Last updated:
apr 23, 2017
Indicators value changes by year
Meaning:
0.057
Minimum:
0.008
jan 1, 2001
Maximum:
0.152
jan 1, 2009
At the date of observation
Value
Absolute change
Change from the previous value
jan 1, 2001
0.008
+0.008
0.0%
jan 1, 2002
0.074
+0.066
847.09%
jan 1, 2003
0.01
-0.064
-86.91%
jan 1, 2004
0.017
+0.007
74.0%
jan 1, 2005
0.113
+0.096
570.84%
jan 1, 2006
0.083
-0.03
-26.35%
jan 1, 2007
0.088
+0.004
5.28%
jan 1, 2008
0.106
+0.019
21.09%
jan 1, 2009
0.152
+0.046
42.8%
jan 1, 2010
0.033
-0.119
-78.42%
jan 1, 2011
0.056
+0.023
70.82%
jan 1, 2012
0.073
+0.017
29.64%
jan 1, 2013
0.048
-0.025
-33.74%
jan 1, 2014
0.023
-0.026
-53.1%
jan 1, 2015
0.021
-0.002
-8.0%
jan 1, 2016
0.008
-0.013
-60.28%
Ranking of countries by current statistics by years