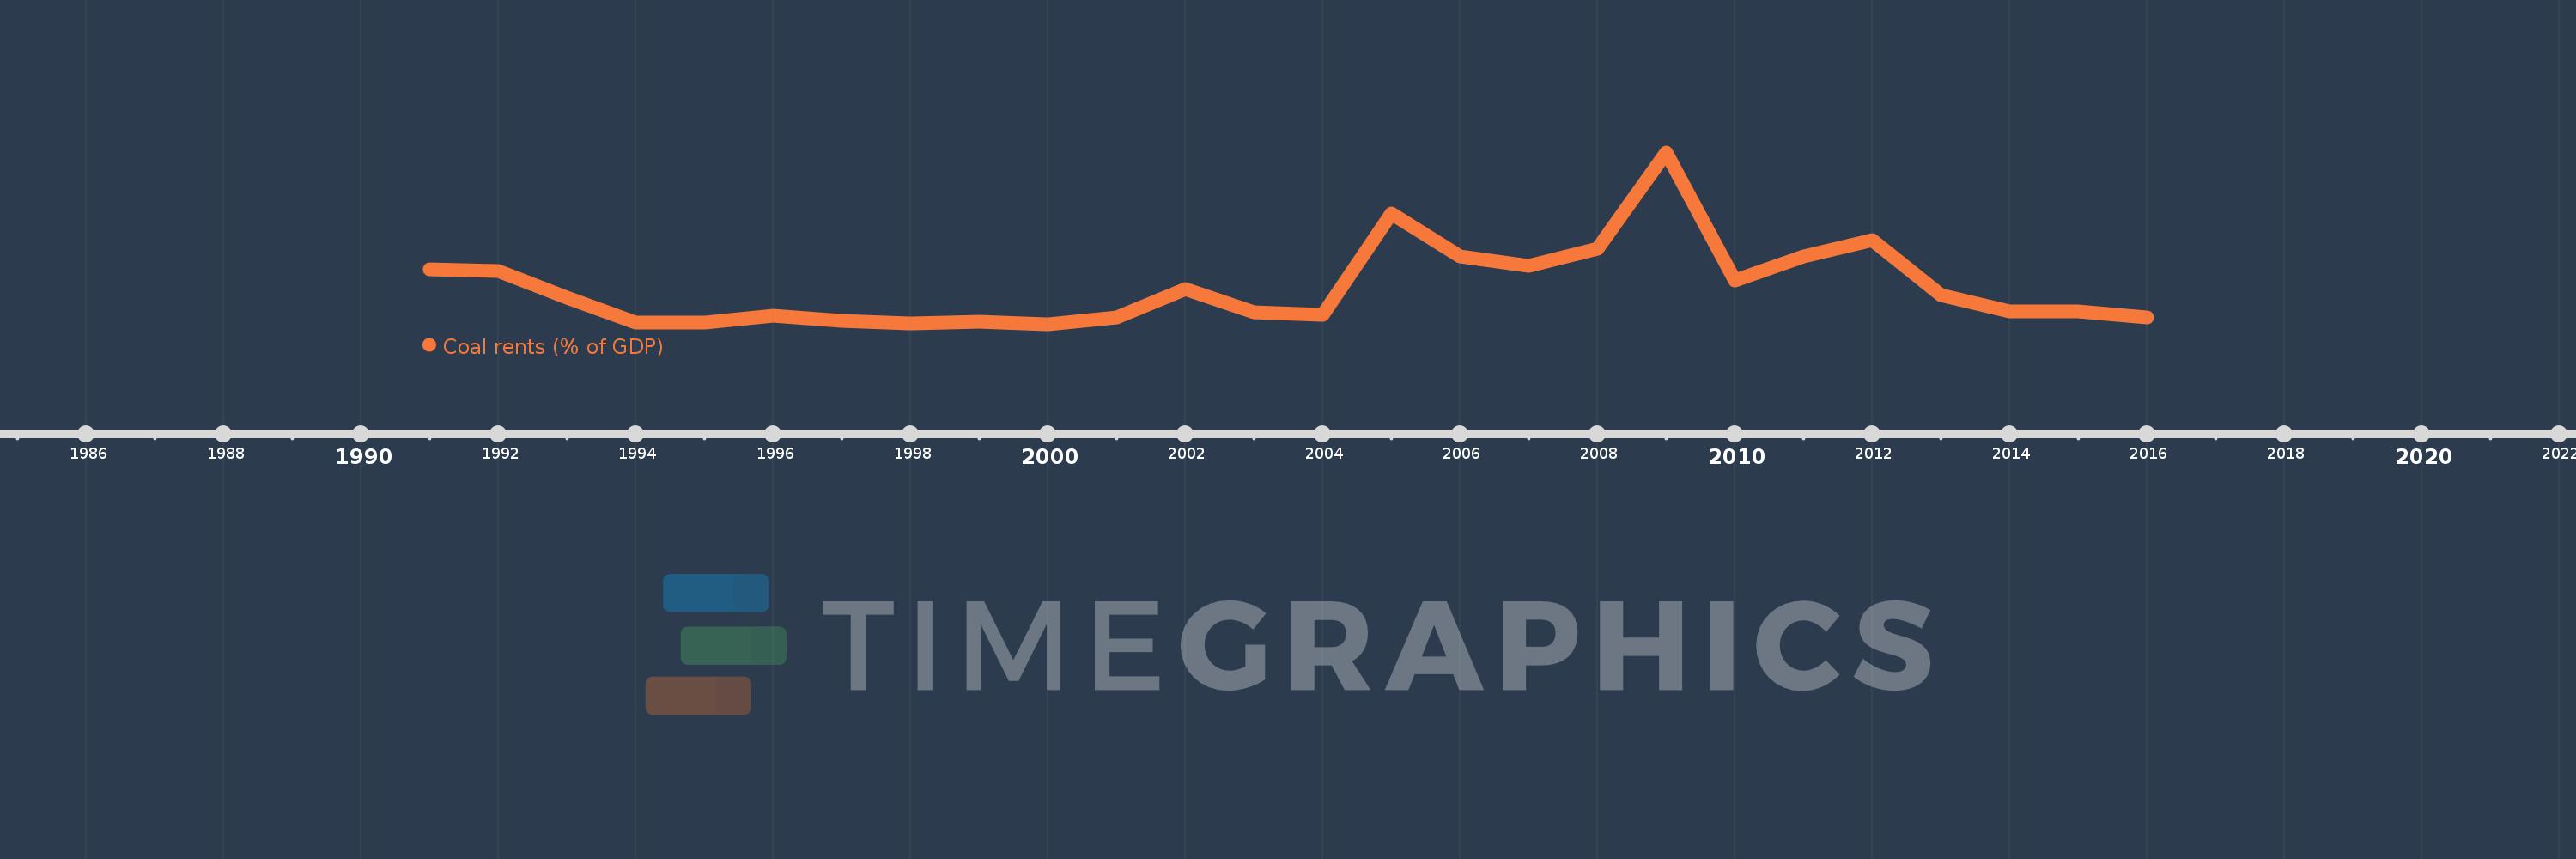
This timeline shows a graph from 1991 to 2016 of Uzbekistan. No data until 1990. Number of actual observations by date: 26.
Source name:
World Development Indicators
Source organization:
Estimates based on sources and methods described in "The Changing Wealth of Nations: Measuring Sustainable Development in the New Millennium" (World Bank, 2011).
Categories, topics:
Environment
Last updated:
apr 23, 2017
Indicators value changes by year
Meaning:
0.106
Minimum:
0.002
jan 1, 2000
Maximum:
0.486
jan 1, 2009
At the date of observation
Value
Absolute change
Change from the previous value
jan 1, 1991
0.157
+0.157
0.0%
jan 1, 1992
0.151
-0.005
-3.42%
jan 1, 1993
0.076
-0.075
-49.72%
jan 1, 1994
0.006
-0.07
-92.35%
jan 1, 1995
0.007
+0.001
19.02%
jan 1, 1996
0.027
+0.02
286.53%
jan 1, 1997
0.012
-0.015
-54.71%
jan 1, 1998
0.005
-0.007
-59.9%
jan 1, 1999
0.009
+0.004
81.42%
jan 1, 2000
0.002
-0.007
-77.39%
jan 1, 2001
0.021
+0.019
930.28%
jan 1, 2002
0.101
+0.08
390.27%
jan 1, 2003
0.036
-0.065
-64.23%
jan 1, 2004
0.029
-0.007
-20.23%
jan 1, 2005
0.313
+0.284
986.33%
jan 1, 2006
0.192
-0.12
-38.49%
jan 1, 2007
0.167
-0.026
-13.31%
jan 1, 2008
0.215
+0.049
29.2%
jan 1, 2009
0.486
+0.27
125.4%
jan 1, 2010
0.124
-0.361
-74.39%
jan 1, 2011
0.193
+0.068
54.89%
jan 1, 2012
0.239
+0.046
23.94%
jan 1, 2013
0.085
-0.153
-64.23%
jan 1, 2014
0.038
-0.048
-55.7%
jan 1, 2015
0.037
-0.001
-2.4%
jan 1, 2016
0.02
-0.017
-45.66%
Ranking of countries by current statistics by years