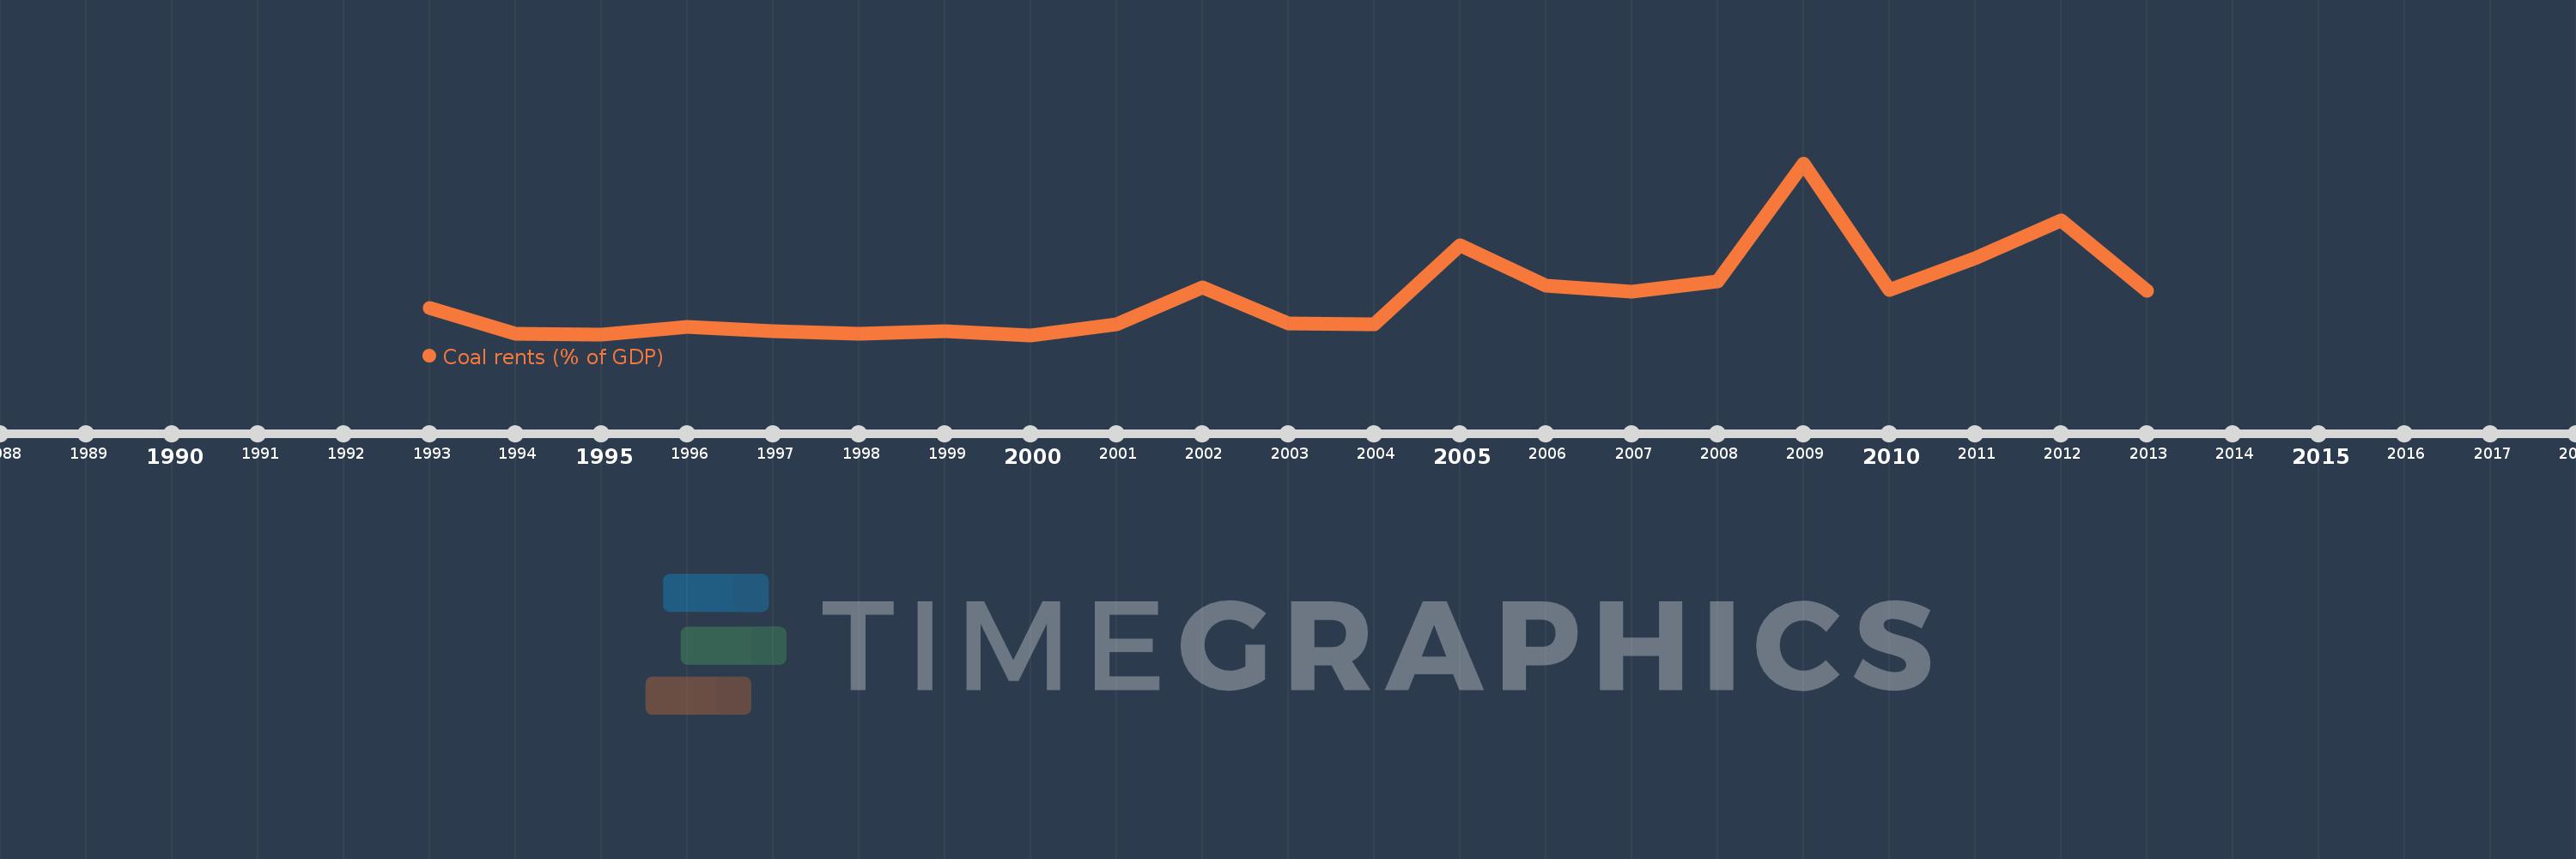
This timeline shows a graph from 1993 to 2013 of Macedonia, FYR. No data until 1992. Number of actual observations by date: 21.
Source name:
World Development Indicators
Source organization:
Estimates based on sources and methods described in "The Changing Wealth of Nations: Measuring Sustainable Development in the New Millennium" (World Bank, 2011).
Categories, topics:
Environment
Last updated:
apr 23, 2017
Indicators value changes by year
Meaning:
0.501
Minimum:
0.016
jan 1, 2000
Maximum:
2.159
jan 1, 2009
At the date of observation
Value
Absolute change
Change from the previous value
jan 1, 1993
0.358
+0.358
0.0%
jan 1, 1994
0.029
-0.329
-91.98%
jan 1, 1995
0.025
-0.004
-13.57%
jan 1, 1996
0.123
+0.098
395.6%
jan 1, 1997
0.061
-0.062
-50.39%
jan 1, 1998
0.031
-0.03
-49.26%
jan 1, 1999
0.067
+0.036
116.01%
jan 1, 2000
0.016
-0.051
-76.65%
jan 1, 2001
0.146
+0.13
835.43%
jan 1, 2002
0.612
+0.466
318.99%
jan 1, 2003
0.159
-0.453
-73.97%
jan 1, 2004
0.151
-0.008
-4.87%
jan 1, 2005
1.132
+0.98
647.24%
jan 1, 2006
0.633
-0.499
-44.09%
jan 1, 2007
0.562
-0.071
-11.28%
jan 1, 2008
0.691
+0.13
23.1%
jan 1, 2009
2.159
+1.468
212.35%
jan 1, 2010
0.58
-1.579
-73.14%
jan 1, 2011
0.979
+0.399
68.76%
jan 1, 2012
1.444
+0.465
47.56%
jan 1, 2013
0.563
-0.881
-61.01%
Ranking of countries by current statistics by years