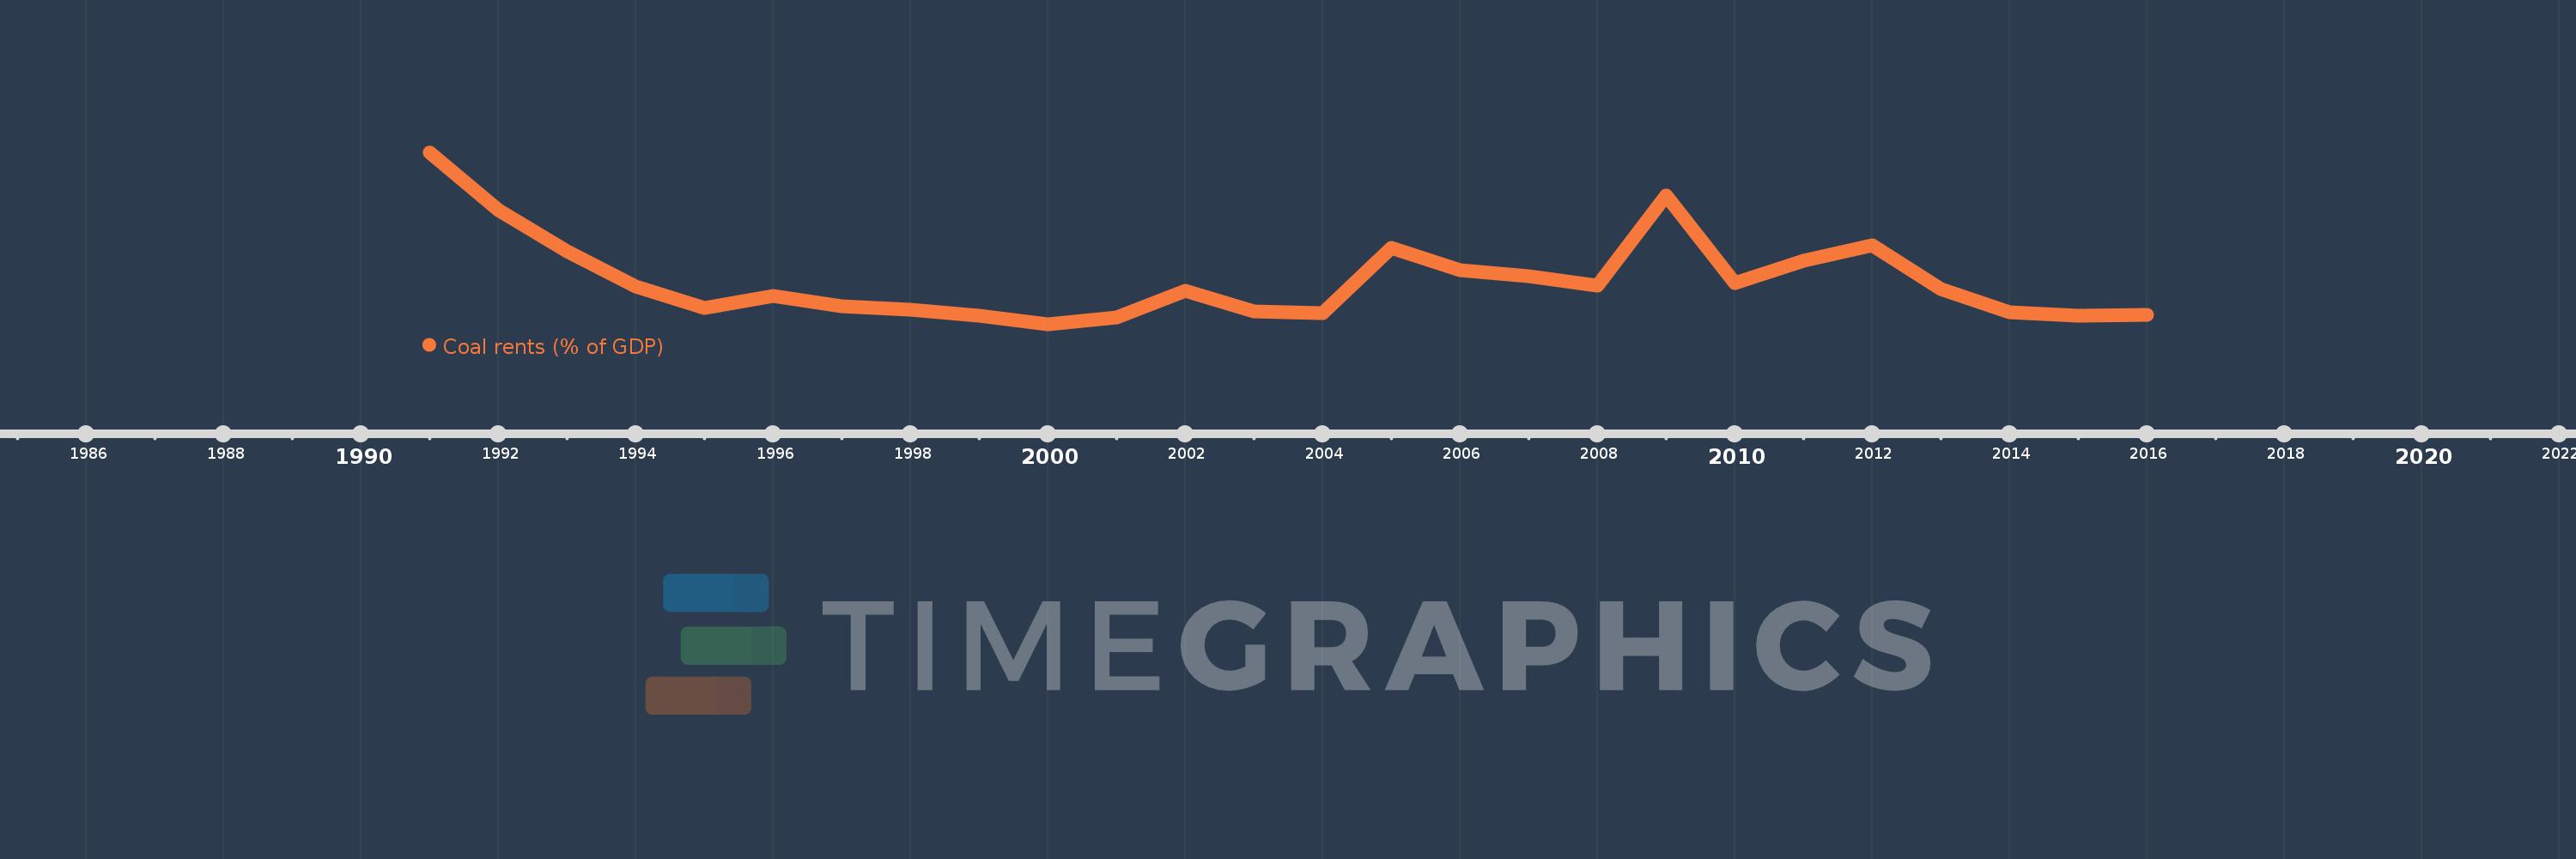
This timeline shows a graph from 1991 to 2016 of Poland. No data until 1990. Number of actual observations by date: 26.
Source name:
World Development Indicators
Source organization:
Estimates based on sources and methods described in "The Changing Wealth of Nations: Measuring Sustainable Development in the New Millennium" (World Bank, 2011).
Categories, topics:
Environment
Last updated:
apr 23, 2017
Indicators value changes by year
Meaning:
0.566
Minimum:
0.098
jan 1, 2000
Maximum:
1.927
jan 1, 1991
At the date of observation
Value
Absolute change
Change from the previous value
jan 1, 1991
1.927
+1.927
0.0%
jan 1, 1992
1.313
-0.614
-31.86%
jan 1, 1993
0.872
-0.441
-33.58%
jan 1, 1994
0.495
-0.378
-43.3%
jan 1, 1995
0.272
-0.223
-45.0%
jan 1, 1996
0.4
+0.128
47.21%
jan 1, 1997
0.292
-0.108
-26.99%
jan 1, 1998
0.252
-0.04
-13.71%
jan 1, 1999
0.188
-0.064
-25.28%
jan 1, 2000
0.098
-0.091
-48.2%
jan 1, 2001
0.173
+0.076
77.46%
jan 1, 2002
0.458
+0.285
164.58%
jan 1, 2003
0.234
-0.225
-49.04%
jan 1, 2004
0.213
-0.021
-8.84%
jan 1, 2005
0.908
+0.695
326.09%
jan 1, 2006
0.674
-0.234
-25.79%
jan 1, 2007
0.609
-0.064
-9.52%
jan 1, 2008
0.51
-0.1
-16.36%
jan 1, 2009
1.473
+0.963
188.96%
jan 1, 2010
0.534
-0.939
-63.74%
jan 1, 2011
0.775
+0.241
45.07%
jan 1, 2012
0.941
+0.166
21.4%
jan 1, 2013
0.475
-0.466
-49.55%
jan 1, 2014
0.224
-0.251
-52.8%
jan 1, 2015
0.193
-0.031
-13.82%
jan 1, 2016
0.202
+0.009
4.77%
Ranking of countries by current statistics by years