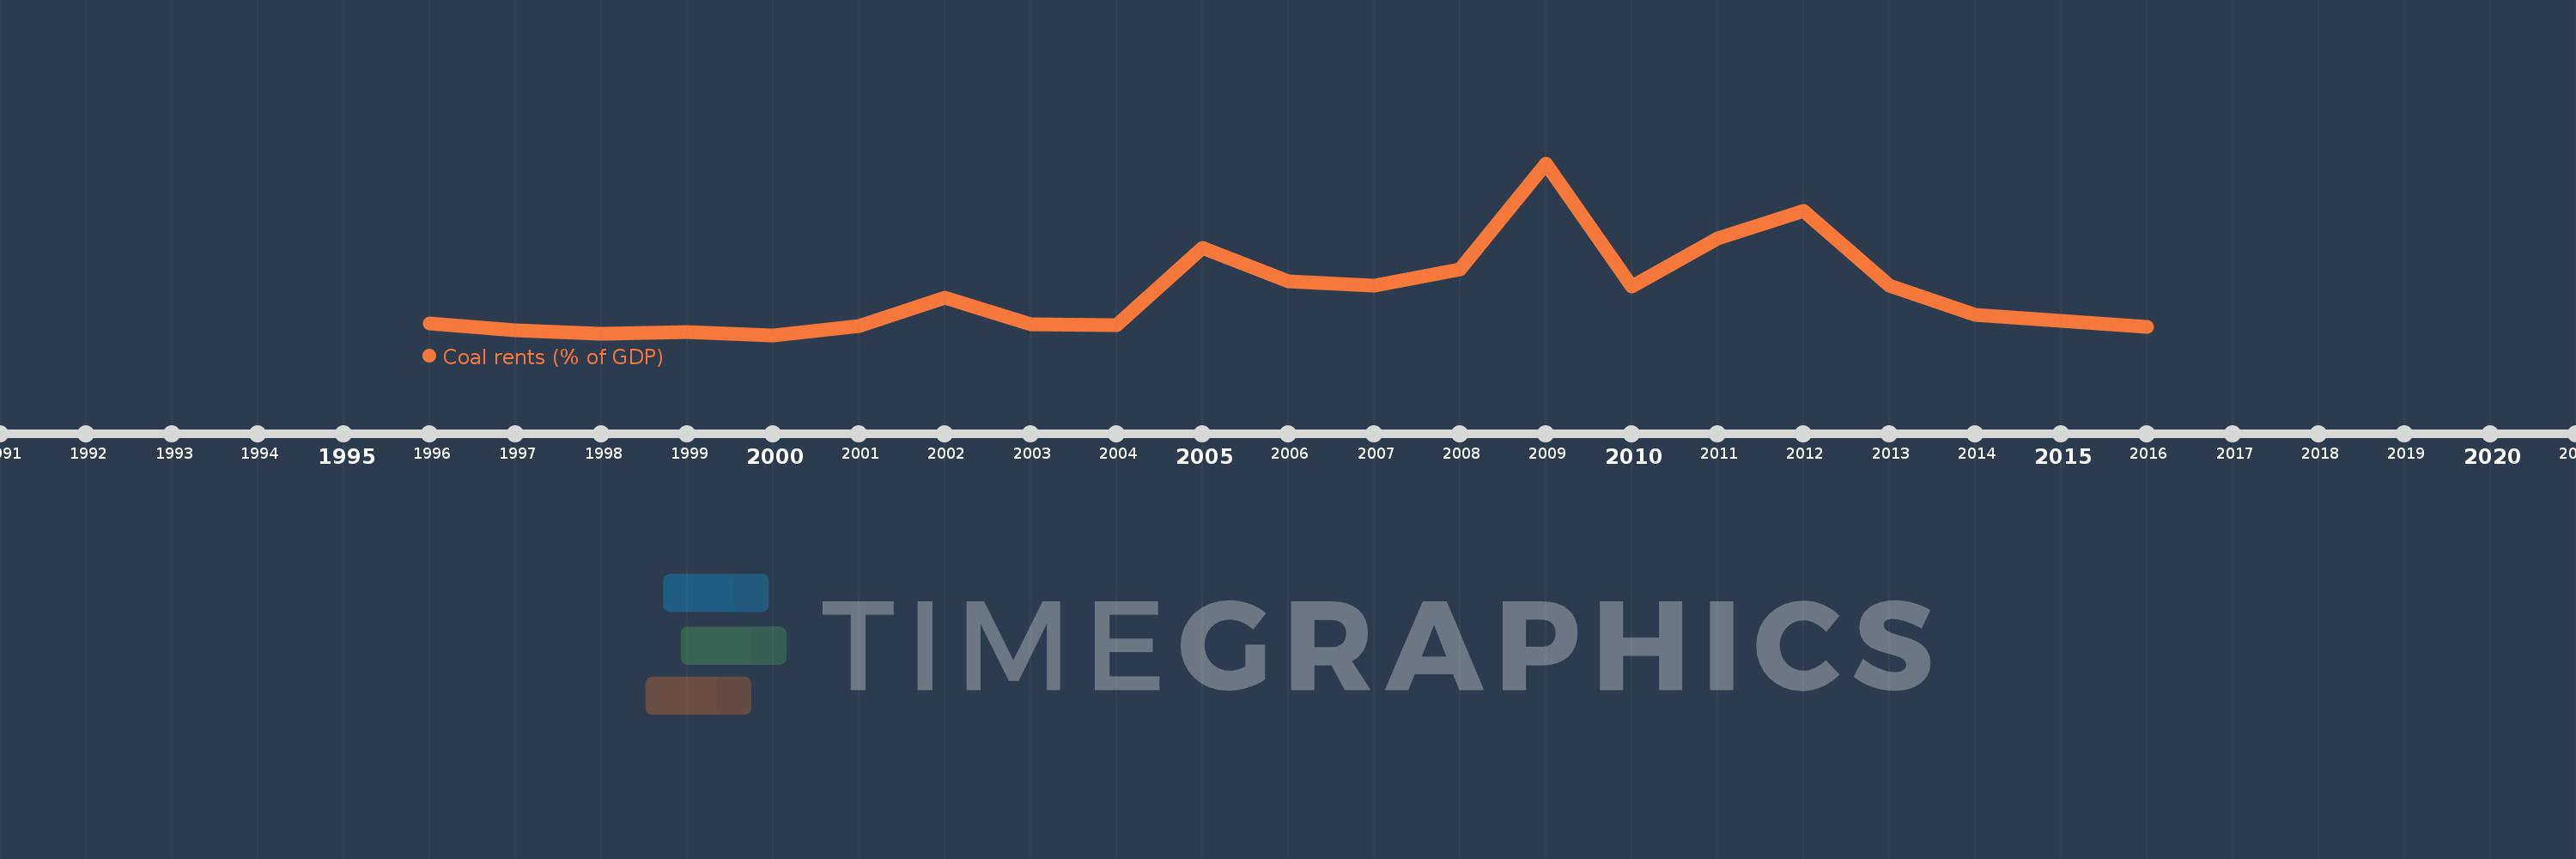
This timeline shows a graph from 1996 to 2016 of Slovenia. No data until 1995. Number of actual observations by date: 21.
Source name:
World Development Indicators
Source organization:
Estimates based on sources and methods described in "The Changing Wealth of Nations: Measuring Sustainable Development in the New Millennium" (World Bank, 2011).
Categories, topics:
Environment
Last updated:
apr 23, 2017
Indicators value changes by year
Meaning:
0.065
Minimum:
0.002
jan 1, 2000
Maximum:
0.262
jan 1, 2009
At the date of observation
Value
Absolute change
Change from the previous value
jan 1, 1996
0.019
+0.019
0.0%
jan 1, 1997
0.009
-0.01
-53.66%
jan 1, 1998
0.004
-0.005
-54.9%
jan 1, 1999
0.007
+0.003
79.91%
jan 1, 2000
0.002
-0.005
-77.13%
jan 1, 2001
0.016
+0.015
925.13%
jan 1, 2002
0.059
+0.042
256.78%
jan 1, 2003
0.018
-0.04
-68.89%
jan 1, 2004
0.017
-0.001
-4.65%
jan 1, 2005
0.134
+0.117
670.91%
jan 1, 2006
0.083
-0.051
-38.12%
jan 1, 2007
0.077
-0.005
-6.54%
jan 1, 2008
0.102
+0.025
31.68%
jan 1, 2009
0.262
+0.16
156.6%
jan 1, 2010
0.075
-0.187
-71.33%
jan 1, 2011
0.148
+0.073
97.07%
jan 1, 2012
0.19
+0.042
28.45%
jan 1, 2013
0.077
-0.113
-59.43%
jan 1, 2014
0.033
-0.044
-56.71%
jan 1, 2015
0.023
-0.01
-31.06%
jan 1, 2016
0.014
-0.009
-37.15%
Ranking of countries by current statistics by years