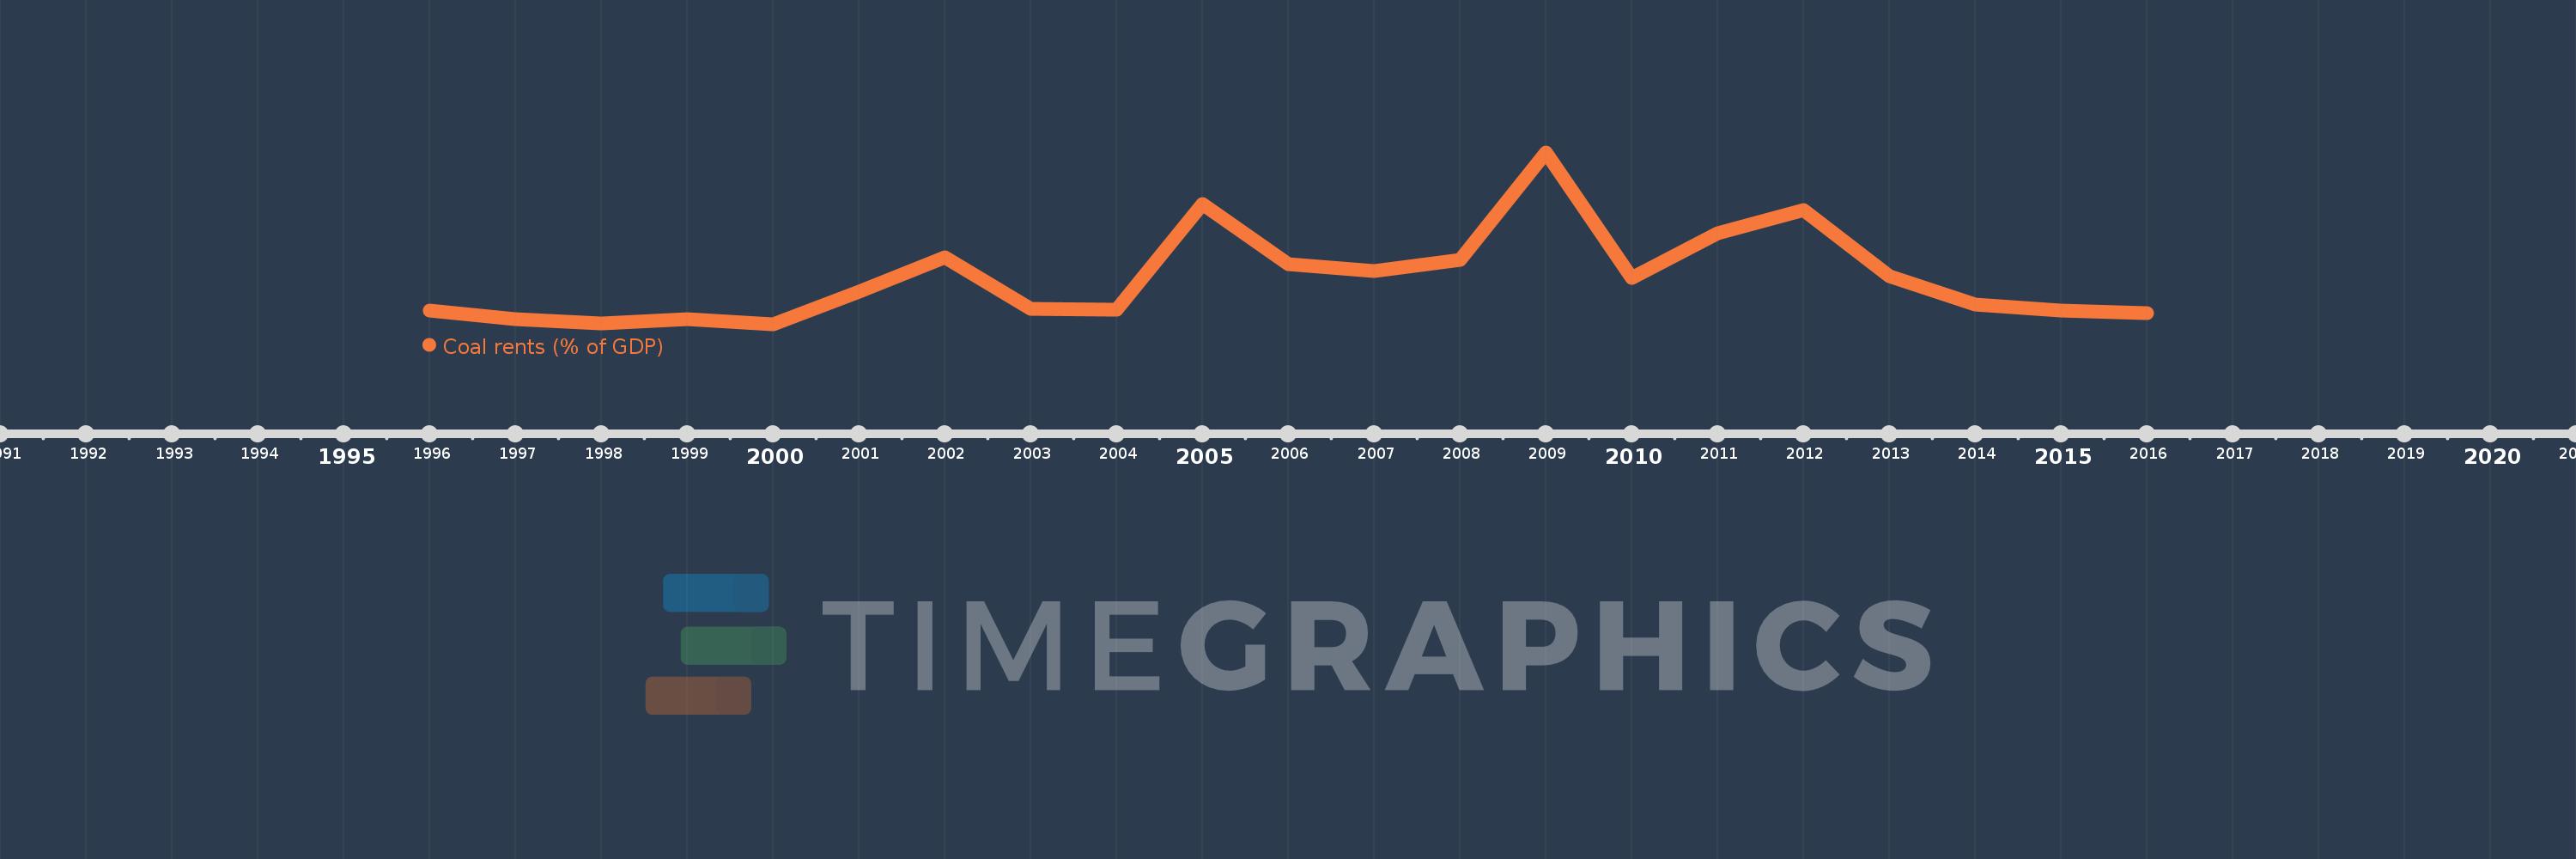
This timeline shows a graph from 1996 to 2016 of Serbia. No data until 1995. Number of actual observations by date: 21.
Source name:
World Development Indicators
Source organization:
Estimates based on sources and methods described in "The Changing Wealth of Nations: Measuring Sustainable Development in the New Millennium" (World Bank, 2011).
Categories, topics:
Environment
Last updated:
apr 23, 2017
Indicators value changes by year
Meaning:
0.56
Minimum:
0.014
jan 1, 2000
Maximum:
2.049
jan 1, 2009
At the date of observation
Value
Absolute change
Change from the previous value
jan 1, 1996
0.176
+0.176
0.0%
jan 1, 1997
0.073
-0.103
-58.45%
jan 1, 1998
0.027
-0.046
-62.81%
jan 1, 1999
0.07
+0.043
158.8%
jan 1, 2000
0.014
-0.057
-80.68%
jan 1, 2001
0.401
+0.387
2.85K%
jan 1, 2002
0.81
+0.409
101.96%
jan 1, 2003
0.197
-0.613
-75.7%
jan 1, 2004
0.187
-0.009
-4.74%
jan 1, 2005
1.437
+1.25
666.86%
jan 1, 2006
0.723
-0.714
-49.71%
jan 1, 2007
0.647
-0.075
-10.43%
jan 1, 2008
0.775
+0.128
19.79%
jan 1, 2009
2.049
+1.274
164.26%
jan 1, 2010
0.559
-1.49
-72.72%
jan 1, 2011
1.087
+0.528
94.51%
jan 1, 2012
1.366
+0.279
25.64%
jan 1, 2013
0.582
-0.784
-57.37%
jan 1, 2014
0.249
-0.333
-57.18%
jan 1, 2015
0.18
-0.069
-27.86%
jan 1, 2016
0.143
-0.037
-20.51%
Ranking of countries by current statistics by years