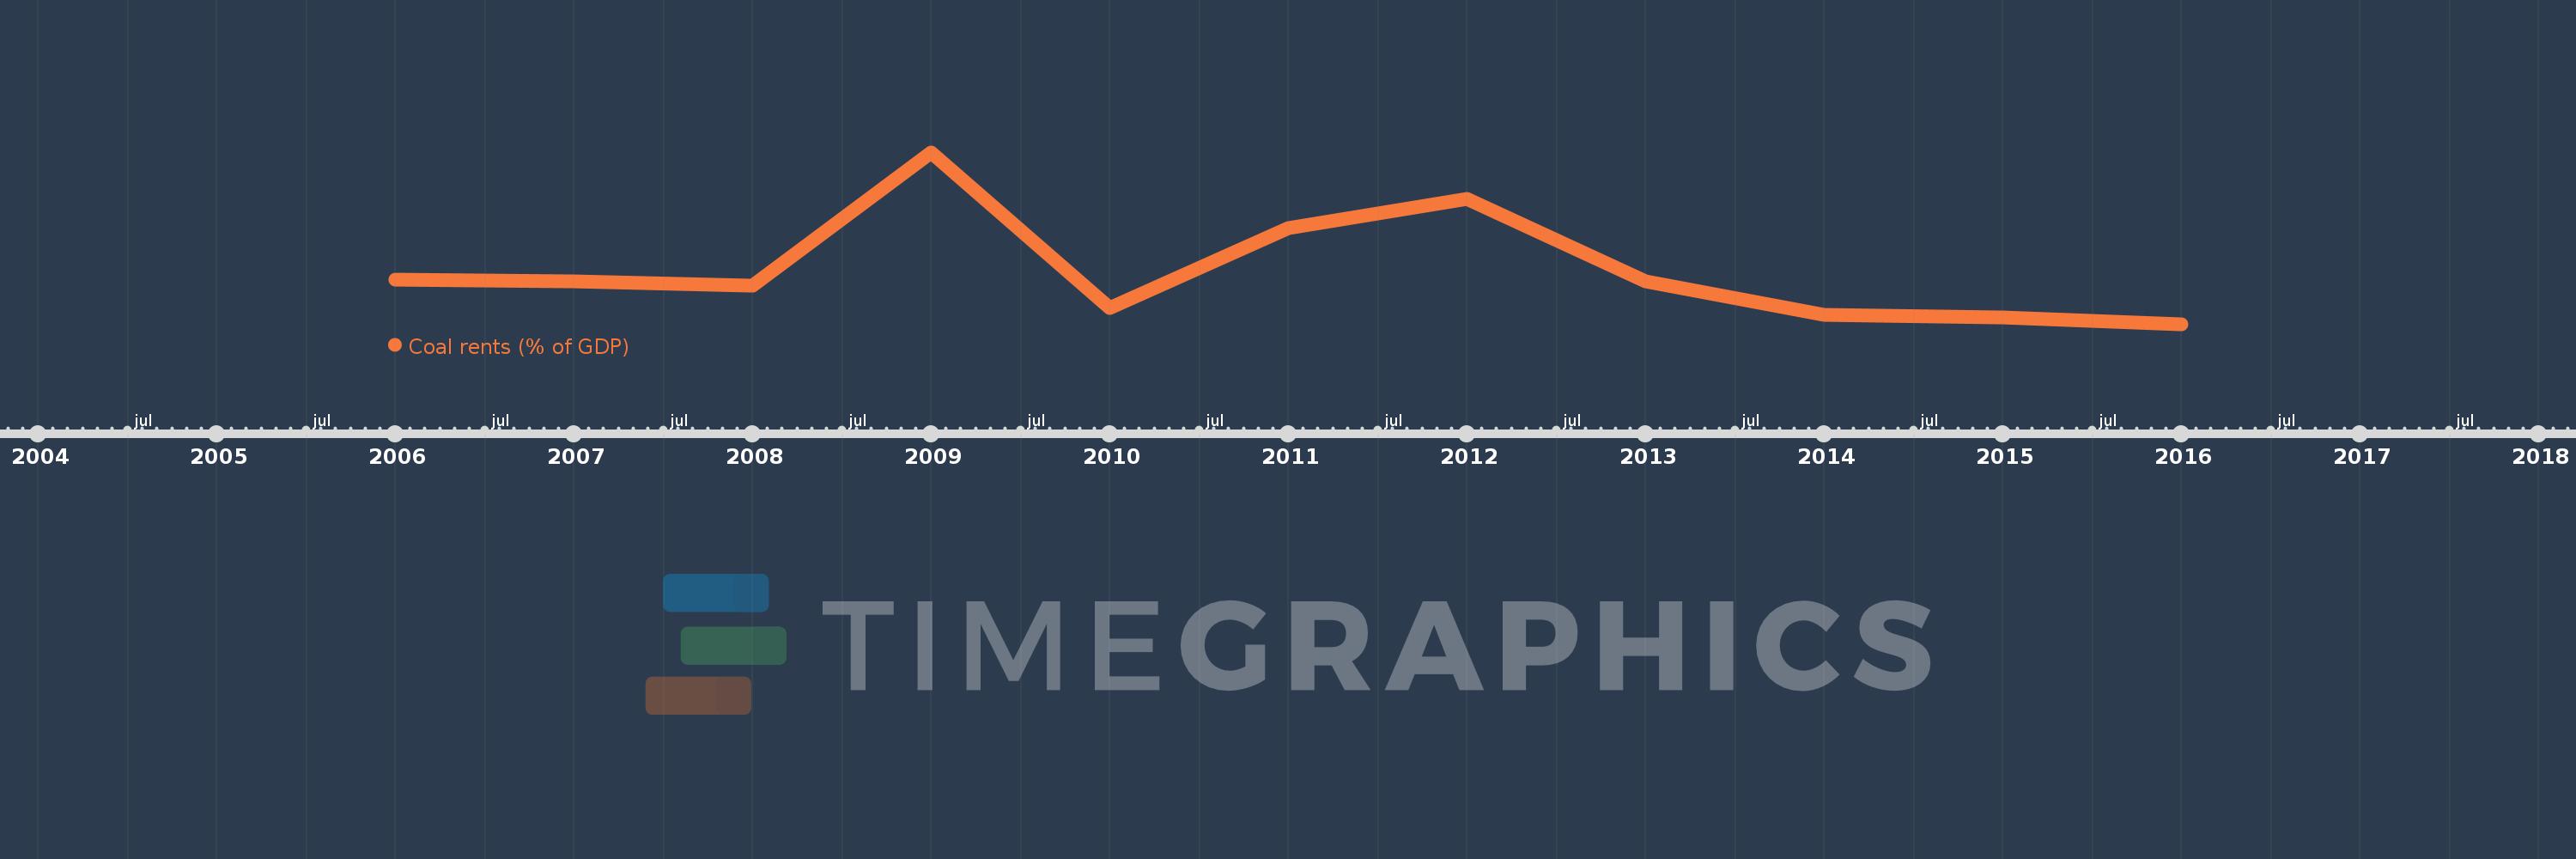
This timeline shows a graph from 2006 to 2016 of Montenegro. No data until 2005. Number of actual observations by date: 11.
Source name:
World Development Indicators
Source organization:
Estimates based on sources and methods described in "The Changing Wealth of Nations: Measuring Sustainable Development in the New Millennium" (World Bank, 2011).
Categories, topics:
Environment
Last updated:
apr 23, 2017
Indicators value changes by year
Meaning:
0.376
Minimum:
0.072
jan 1, 2016
Maximum:
1.039
jan 1, 2009
At the date of observation
Value
Absolute change
Change from the previous value
jan 1, 2006
0.323
+0.323
0.0%
jan 1, 2007
0.311
-0.013
-3.91%
jan 1, 2008
0.287
-0.024
-7.62%
jan 1, 2009
1.039
+0.753
262.3%
jan 1, 2010
0.165
-0.874
-84.11%
jan 1, 2011
0.611
+0.446
270.06%
jan 1, 2012
0.776
+0.164
26.9%
jan 1, 2013
0.313
-0.462
-59.62%
jan 1, 2014
0.123
-0.19
-60.62%
jan 1, 2015
0.11
-0.013
-10.45%
jan 1, 2016
0.072
-0.039
-35.03%
Ranking of countries by current statistics by years