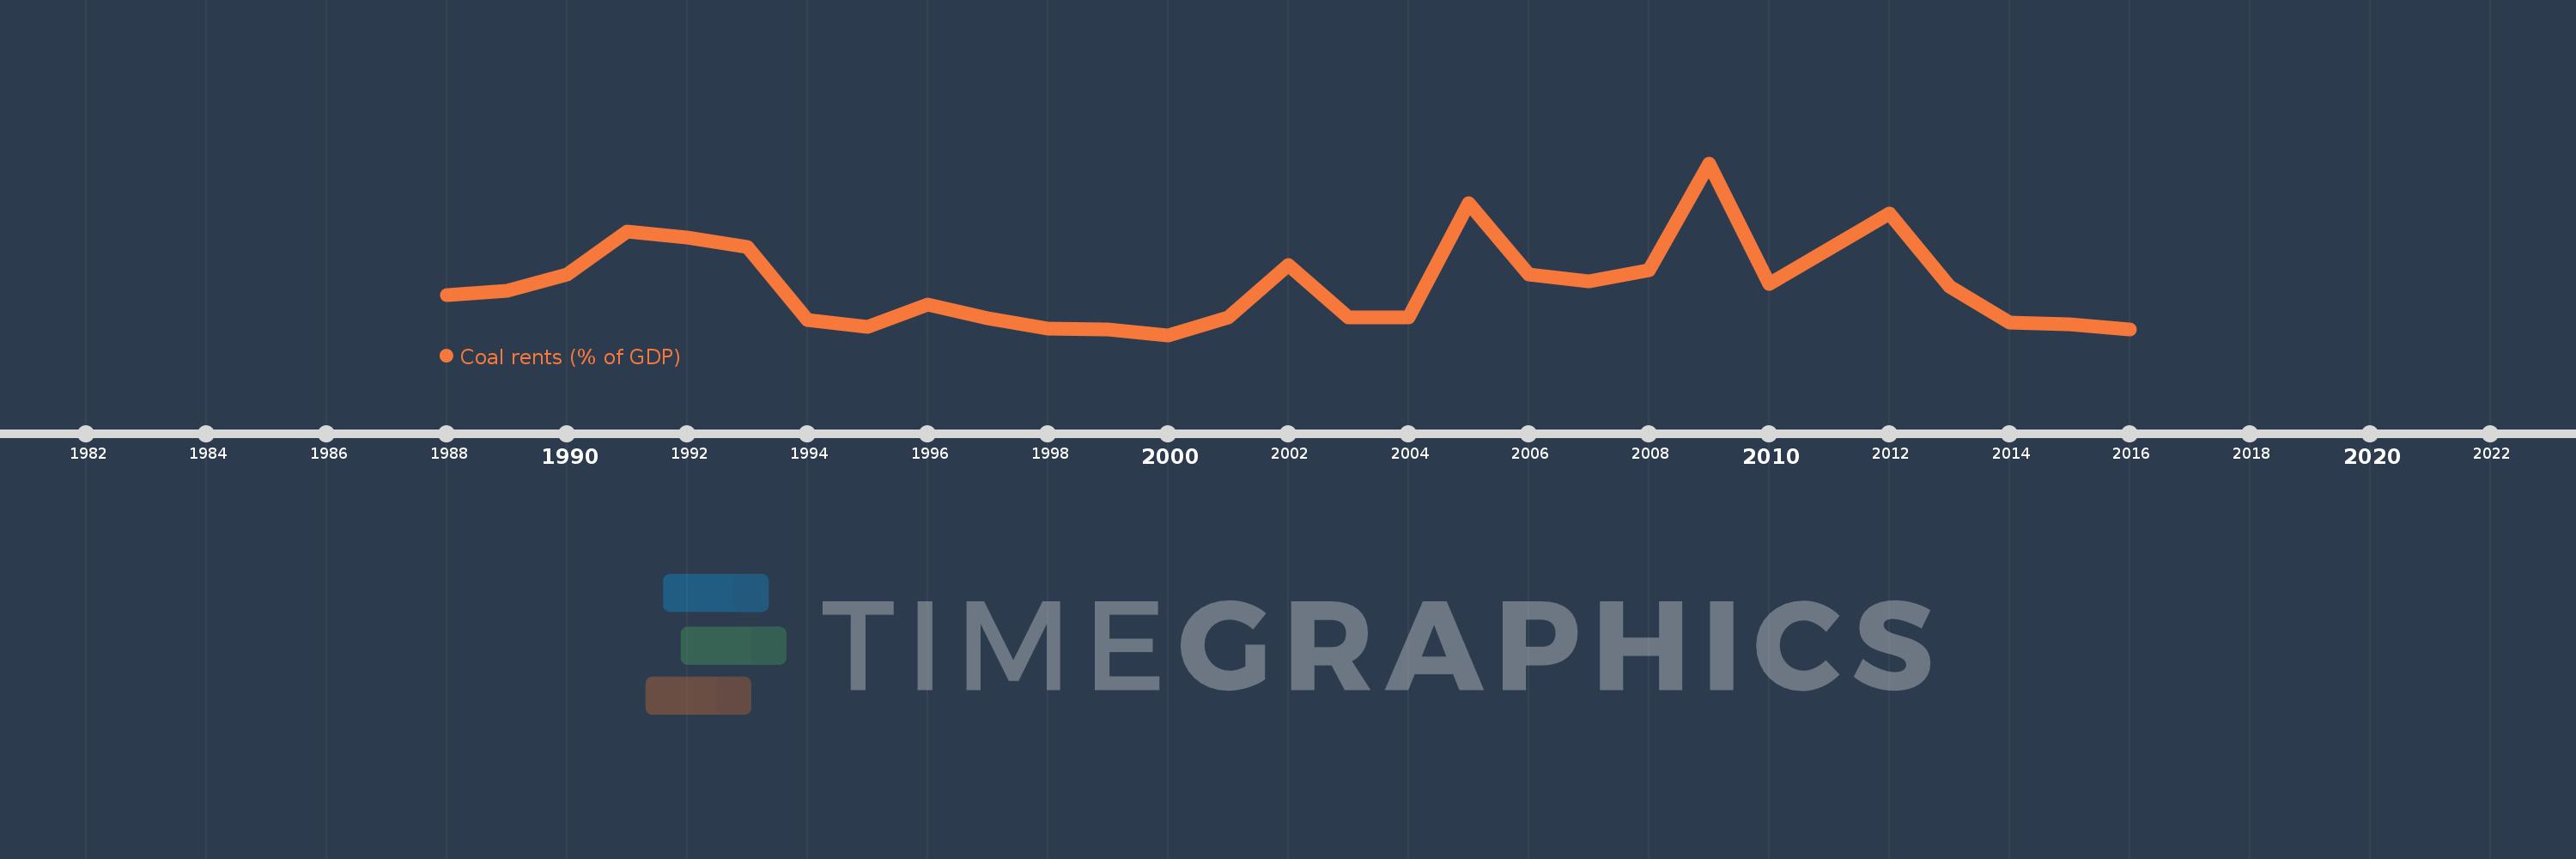
This timeline shows a graph from 1988 to 2016 of Romania. No data until 1987. Number of actual observations by date: 29.
Source name:
World Development Indicators
Source organization:
Estimates based on sources and methods described in "The Changing Wealth of Nations: Measuring Sustainable Development in the New Millennium" (World Bank, 2011).
Categories, topics:
Environment
Last updated:
apr 23, 2017
Indicators value changes by year
Meaning:
0.124
Minimum:
0.006
jan 1, 2000
Maximum:
0.41
jan 1, 2009
At the date of observation
Value
Absolute change
Change from the previous value
jan 1, 1988
0.099
+0.099
0.0%
jan 1, 1989
0.111
+0.012
12.07%
jan 1, 1990
0.148
+0.037
33.79%
jan 1, 1991
0.25
+0.102
69.1%
jan 1, 1992
0.235
-0.016
-6.32%
jan 1, 1993
0.214
-0.021
-8.77%
jan 1, 1994
0.042
-0.172
-80.45%
jan 1, 1995
0.026
-0.016
-37.07%
jan 1, 1996
0.077
+0.051
192.62%
jan 1, 1997
0.045
-0.032
-41.12%
jan 1, 1998
0.022
-0.023
-50.67%
jan 1, 1999
0.02
-0.002
-8.59%
jan 1, 2000
0.006
-0.014
-69.53%
jan 1, 2001
0.047
+0.041
654.06%
jan 1, 2002
0.17
+0.123
260.91%
jan 1, 2003
0.048
-0.121
-71.41%
jan 1, 2004
0.048
-0.001
-1.69%
jan 1, 2005
0.317
+0.27
565.9%
jan 1, 2006
0.148
-0.17
-53.44%
jan 1, 2007
0.133
-0.015
-10.08%
jan 1, 2008
0.158
+0.025
19.1%
jan 1, 2009
0.41
+0.252
159.34%
jan 1, 2010
0.127
-0.283
-68.96%
jan 1, 2011
0.209
+0.081
63.7%
jan 1, 2012
0.292
+0.083
39.81%
jan 1, 2013
0.12
-0.171
-58.67%
jan 1, 2014
0.036
-0.085
-70.15%
jan 1, 2015
0.031
-0.005
-13.69%
jan 1, 2016
0.02
-0.011
-35.6%
Ranking of countries by current statistics by years