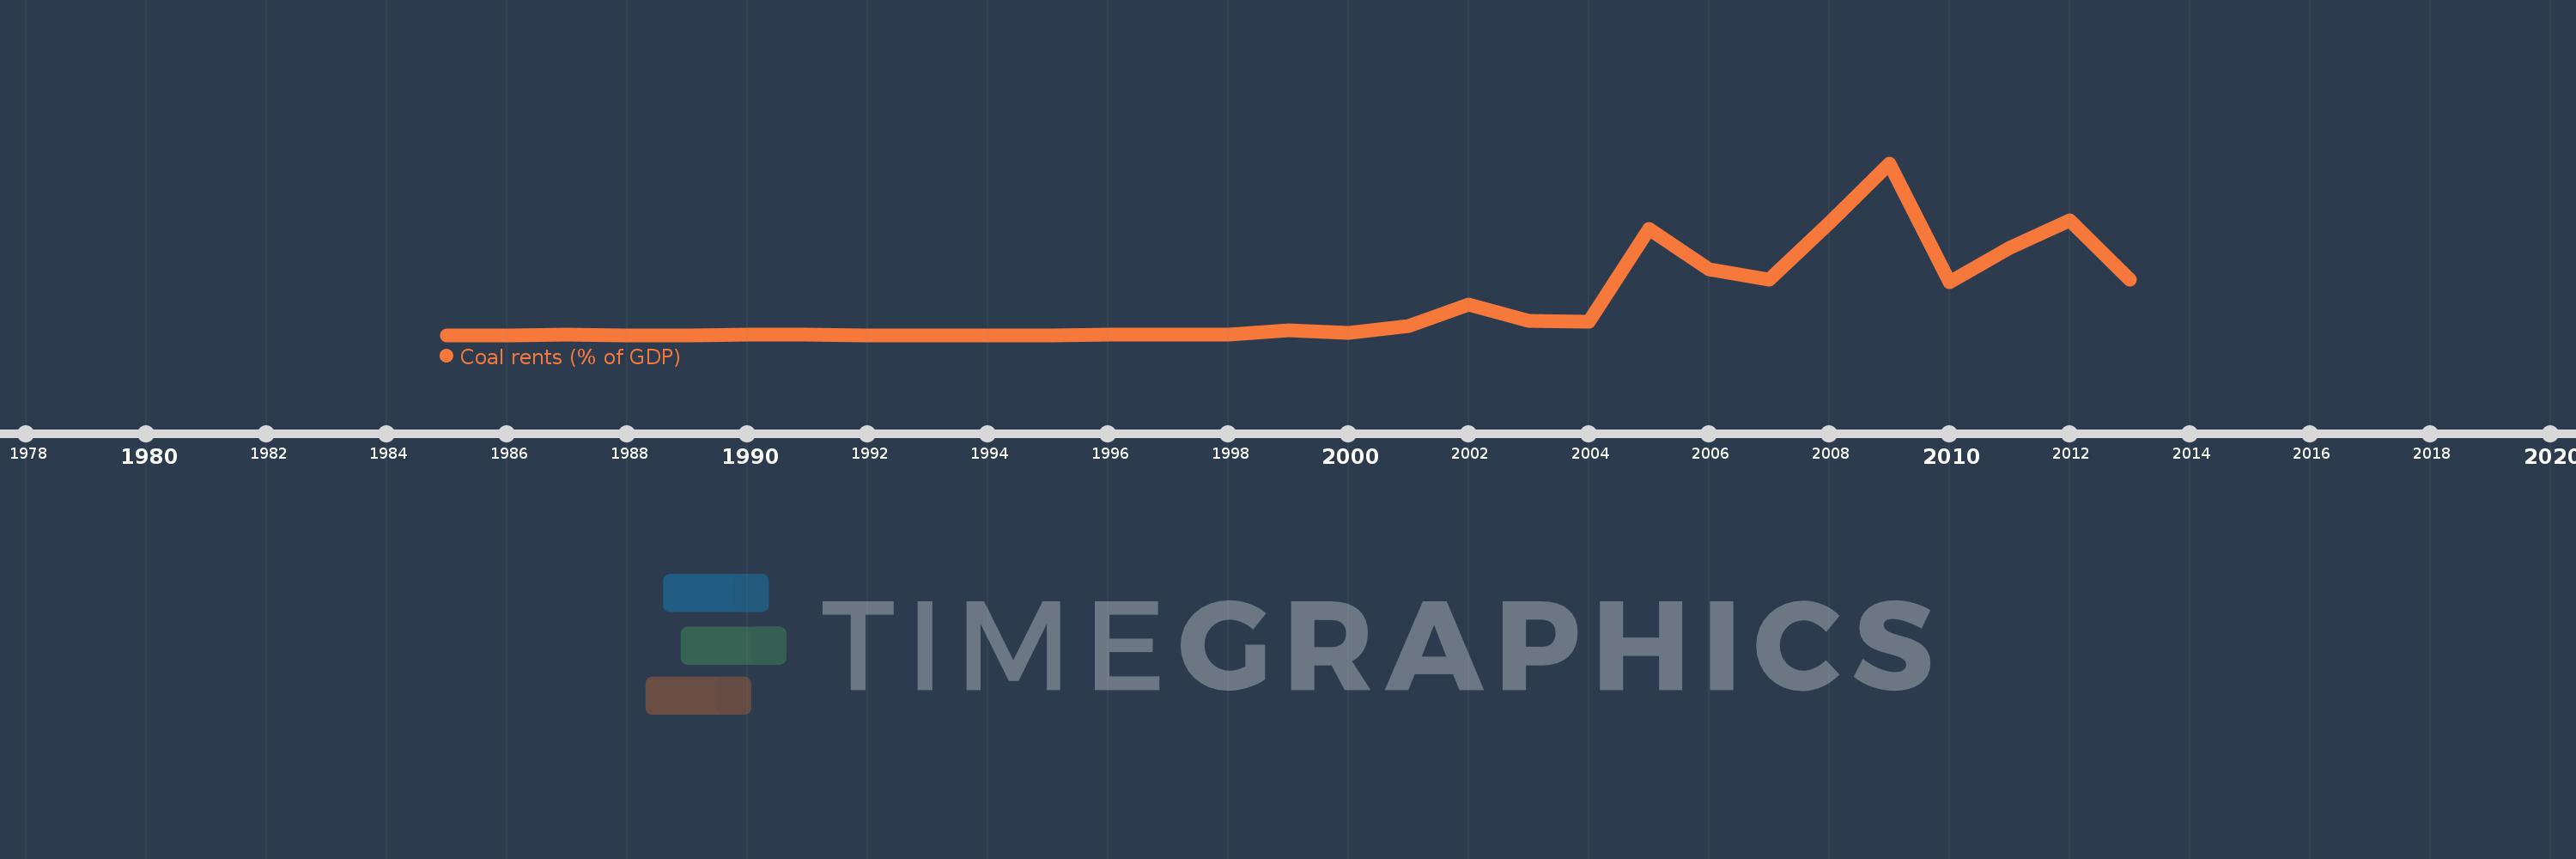
This timeline shows a graph from 1985 to 2013 of Lao PDR. No data until 1984. Number of actual observations by date: 29.
Source name:
World Development Indicators
Source organization:
Estimates based on sources and methods described in "The Changing Wealth of Nations: Measuring Sustainable Development in the New Millennium" (World Bank, 2011).
Categories, topics:
Environment
Last updated:
apr 23, 2017
Indicators value changes by year
Meaning:
0.159
Minimum:
0.0
jan 1, 1995
Maximum:
0.884
jan 1, 2009
At the date of observation
Value
Absolute change
Change from the previous value
jan 1, 1985
0.0
+0.0
0.0%
jan 1, 1986
0.0
+0.0
134.44%
jan 1, 1987
0.001
+0.0
22.85%
jan 1, 1988
0.0
-0.001
-97.49%
jan 1, 1989
0.0
+0.0
3.2K%
jan 1, 1990
0.001
+0.0
43.64%
jan 1, 1991
0.001
0.0
-4.8%
jan 1, 1992
0.0
0.0
-32.62%
jan 1, 1993
0.0
0.0
-56.15%
jan 1, 1994
0.0
0.0
-94.59%
jan 1, 1995
0.0
0.0
-15.32%
jan 1, 1996
0.002
+0.002
18.05K%
jan 1, 1997
0.001
-0.001
-55.78%
jan 1, 1998
0.001
+0.0
27.68%
jan 1, 1999
0.024
+0.023
2.63K%
jan 1, 2000
0.012
-0.012
-48.9%
jan 1, 2001
0.048
+0.036
287.7%
jan 1, 2002
0.157
+0.109
226.54%
jan 1, 2003
0.073
-0.084
-53.43%
jan 1, 2004
0.067
-0.006
-7.84%
jan 1, 2005
0.544
+0.477
708.08%
jan 1, 2006
0.336
-0.209
-38.33%
jan 1, 2007
0.285
-0.05
-15.04%
jan 1, 2008
0.577
+0.292
102.45%
jan 1, 2009
0.884
+0.307
53.17%
jan 1, 2010
0.273
-0.611
-69.17%
jan 1, 2011
0.448
+0.175
64.34%
jan 1, 2012
0.592
+0.144
32.22%
jan 1, 2013
0.285
-0.307
-51.9%
Ranking of countries by current statistics by years