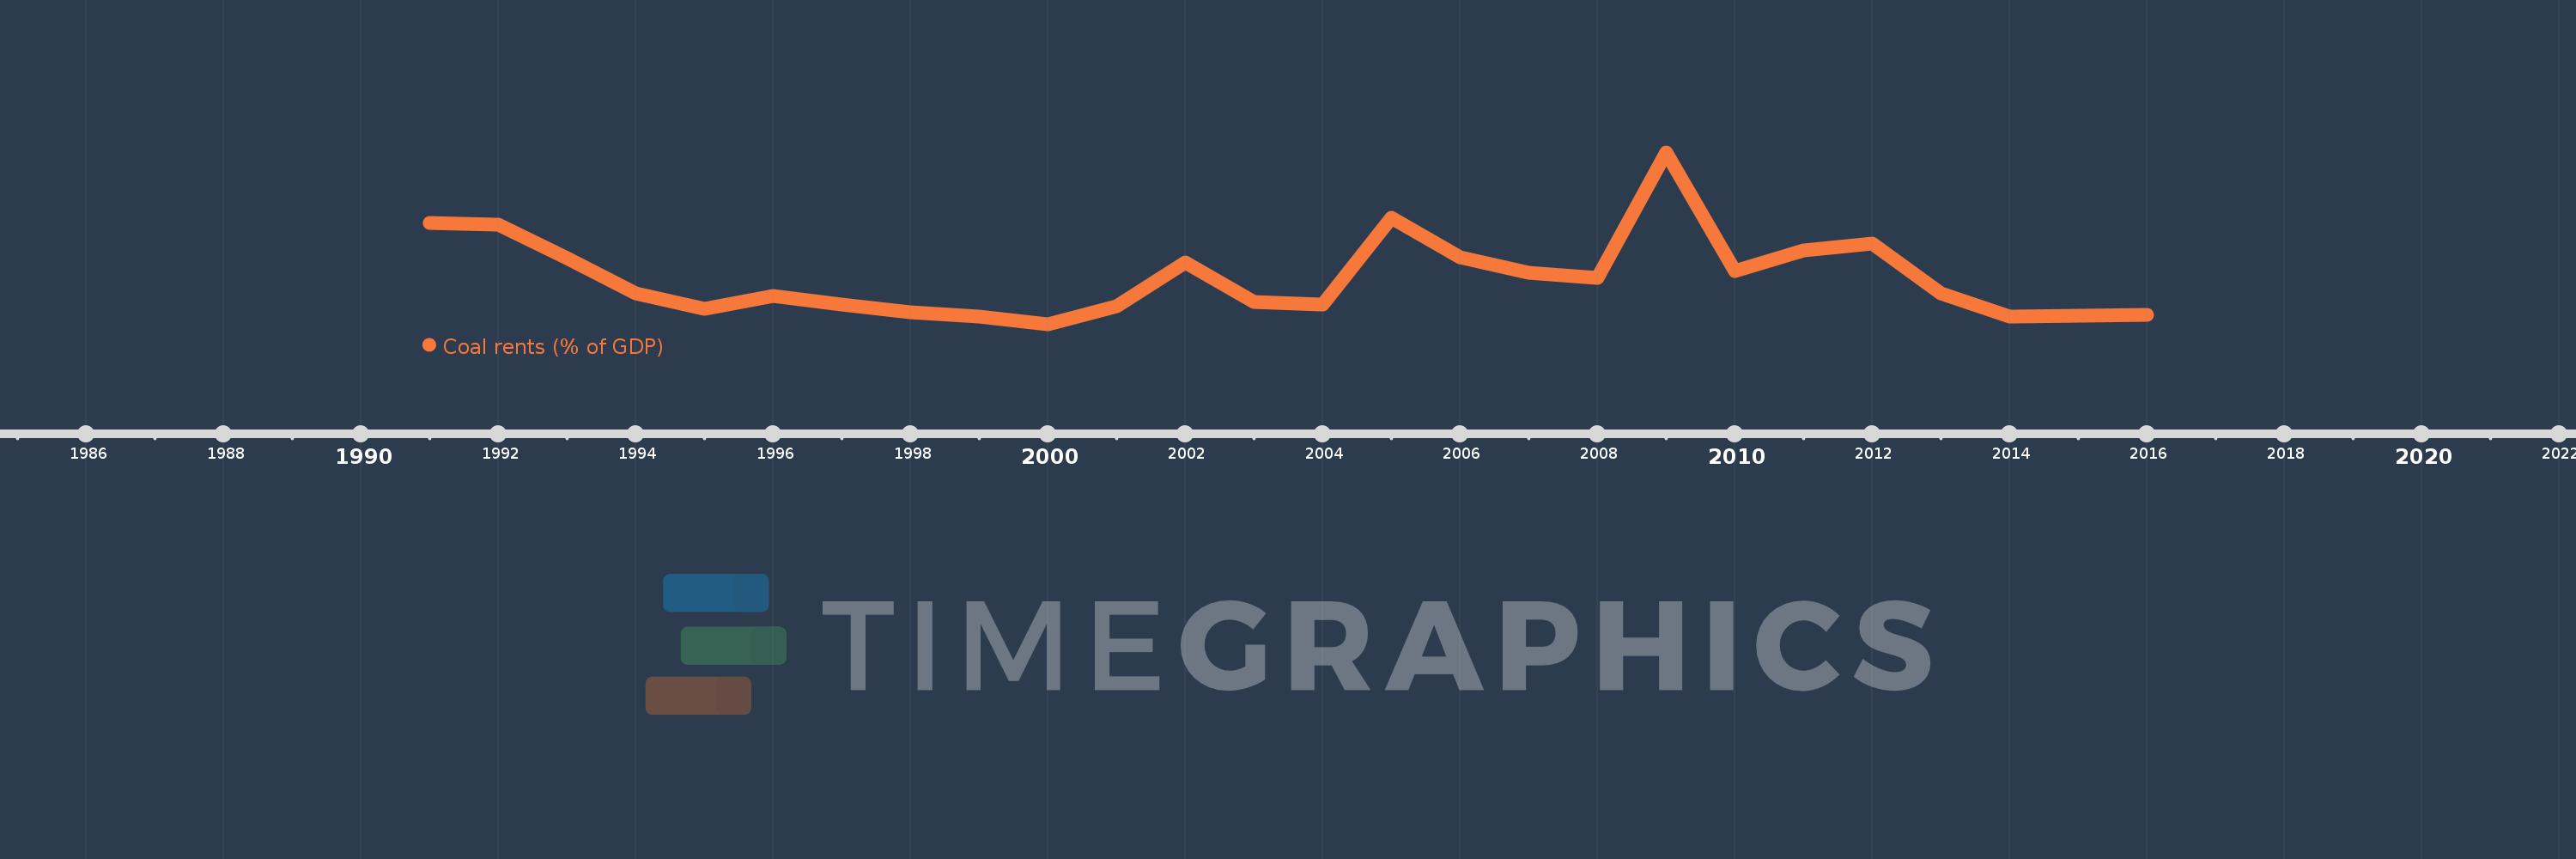
This timeline shows a graph from 1991 to 2016 of Kazakhstan. No data until 1990. Number of actual observations by date: 26.
Source name:
World Development Indicators
Source organization:
Estimates based on sources and methods described in "The Changing Wealth of Nations: Measuring Sustainable Development in the New Millennium" (World Bank, 2011).
Categories, topics:
Environment
Last updated:
apr 23, 2017
Indicators value changes by year
Meaning:
1.447
Minimum:
0.254
jan 1, 2000
Maximum:
4.655
jan 1, 2009
At the date of observation
Value
Absolute change
Change from the previous value
jan 1, 1991
2.855
+2.855
0.0%
jan 1, 1992
2.804
-0.051
-1.8%
jan 1, 1993
1.941
-0.863
-30.78%
jan 1, 1994
1.053
-0.888
-45.74%
jan 1, 1995
0.652
-0.401
-38.06%
jan 1, 1996
0.987
+0.335
51.33%
jan 1, 1997
0.76
-0.227
-23.05%
jan 1, 1998
0.553
-0.206
-27.14%
jan 1, 1999
0.45
-0.104
-18.76%
jan 1, 2000
0.254
-0.195
-43.45%
jan 1, 2001
0.721
+0.467
183.48%
jan 1, 2002
1.843
+1.122
155.73%
jan 1, 2003
0.814
-1.029
-55.82%
jan 1, 2004
0.764
-0.05
-6.17%
jan 1, 2005
2.98
+2.216
290.01%
jan 1, 2006
1.966
-1.014
-34.02%
jan 1, 2007
1.574
-0.392
-19.94%
jan 1, 2008
1.449
-0.124
-7.91%
jan 1, 2009
4.655
+3.206
221.17%
jan 1, 2010
1.621
-3.034
-65.17%
jan 1, 2011
2.14
+0.519
31.99%
jan 1, 2012
2.323
+0.183
8.55%
jan 1, 2013
1.033
-1.29
-55.52%
jan 1, 2014
0.459
-0.574
-55.54%
jan 1, 2015
0.469
+0.01
2.17%
jan 1, 2016
0.494
+0.025
5.28%
Ranking of countries by current statistics by years