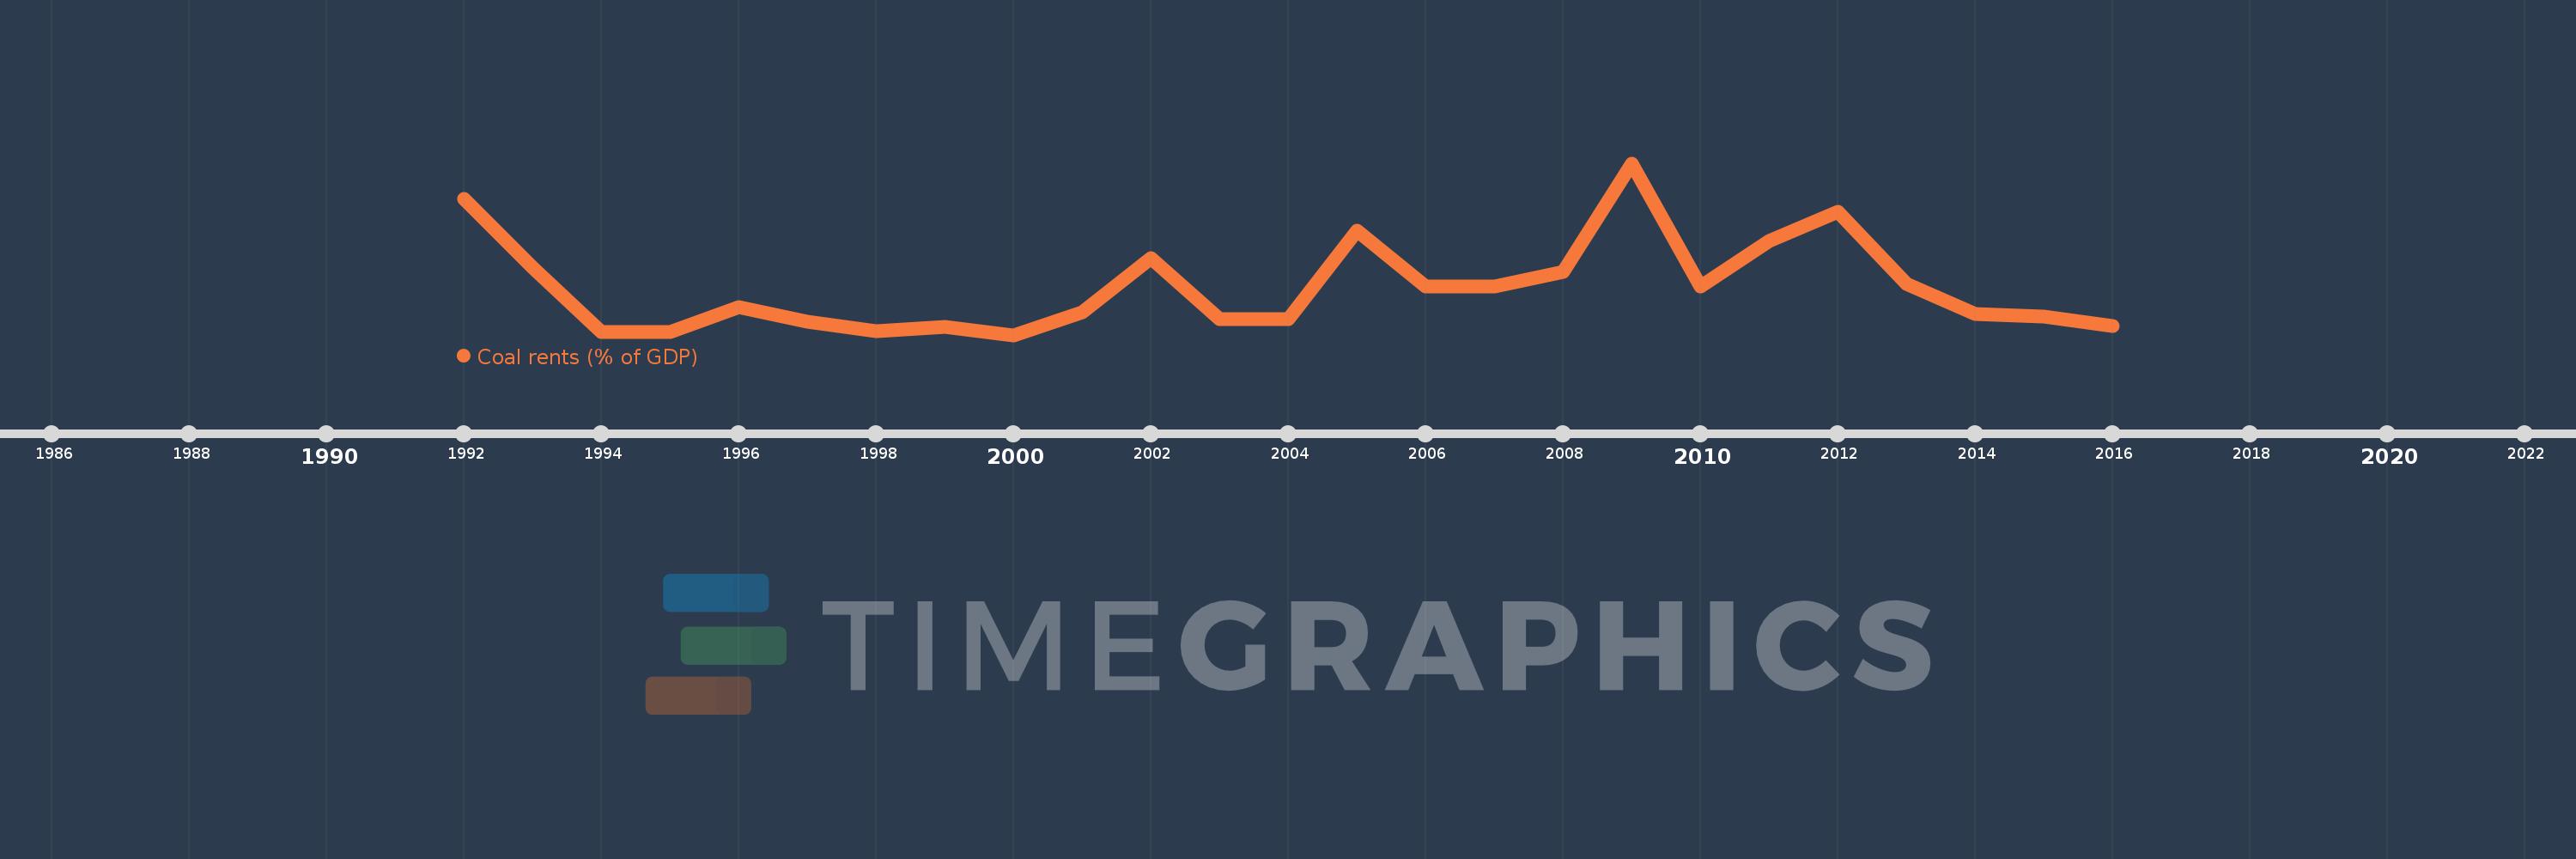
This timeline shows a graph from 1992 to 2016 of Hungary. No data until 1991. Number of actual observations by date: 25.
Source name:
World Development Indicators
Source organization:
Estimates based on sources and methods described in "The Changing Wealth of Nations: Measuring Sustainable Development in the New Millennium" (World Bank, 2011).
Categories, topics:
Environment
Last updated:
apr 23, 2017
Indicators value changes by year
Meaning:
0.038
Minimum:
0.002
jan 1, 2000
Maximum:
0.132
jan 1, 2009
At the date of observation
Value
Absolute change
Change from the previous value
jan 1, 1992
0.105
+0.105
0.0%
jan 1, 1993
0.053
-0.053
-50.09%
jan 1, 1994
0.004
-0.049
-92.68%
jan 1, 1995
0.004
0.0
-0.57%
jan 1, 1996
0.023
+0.02
511.92%
jan 1, 1997
0.012
-0.011
-48.69%
jan 1, 1998
0.005
-0.007
-58.0%
jan 1, 1999
0.008
+0.003
66.63%
jan 1, 2000
0.002
-0.006
-76.14%
jan 1, 2001
0.019
+0.017
858.82%
jan 1, 2002
0.06
+0.041
212.27%
jan 1, 2003
0.014
-0.046
-75.89%
jan 1, 2004
0.014
-0.001
-4.35%
jan 1, 2005
0.081
+0.067
483.12%
jan 1, 2006
0.039
-0.041
-51.18%
jan 1, 2007
0.039
-0.001
-1.8%
jan 1, 2008
0.05
+0.012
30.02%
jan 1, 2009
0.132
+0.082
162.15%
jan 1, 2010
0.039
-0.093
-70.56%
jan 1, 2011
0.073
+0.034
86.59%
jan 1, 2012
0.095
+0.023
31.25%
jan 1, 2013
0.041
-0.054
-56.83%
jan 1, 2014
0.018
-0.023
-56.95%
jan 1, 2015
0.016
-0.002
-10.37%
jan 1, 2016
0.009
-0.006
-40.91%
Ranking of countries by current statistics by years