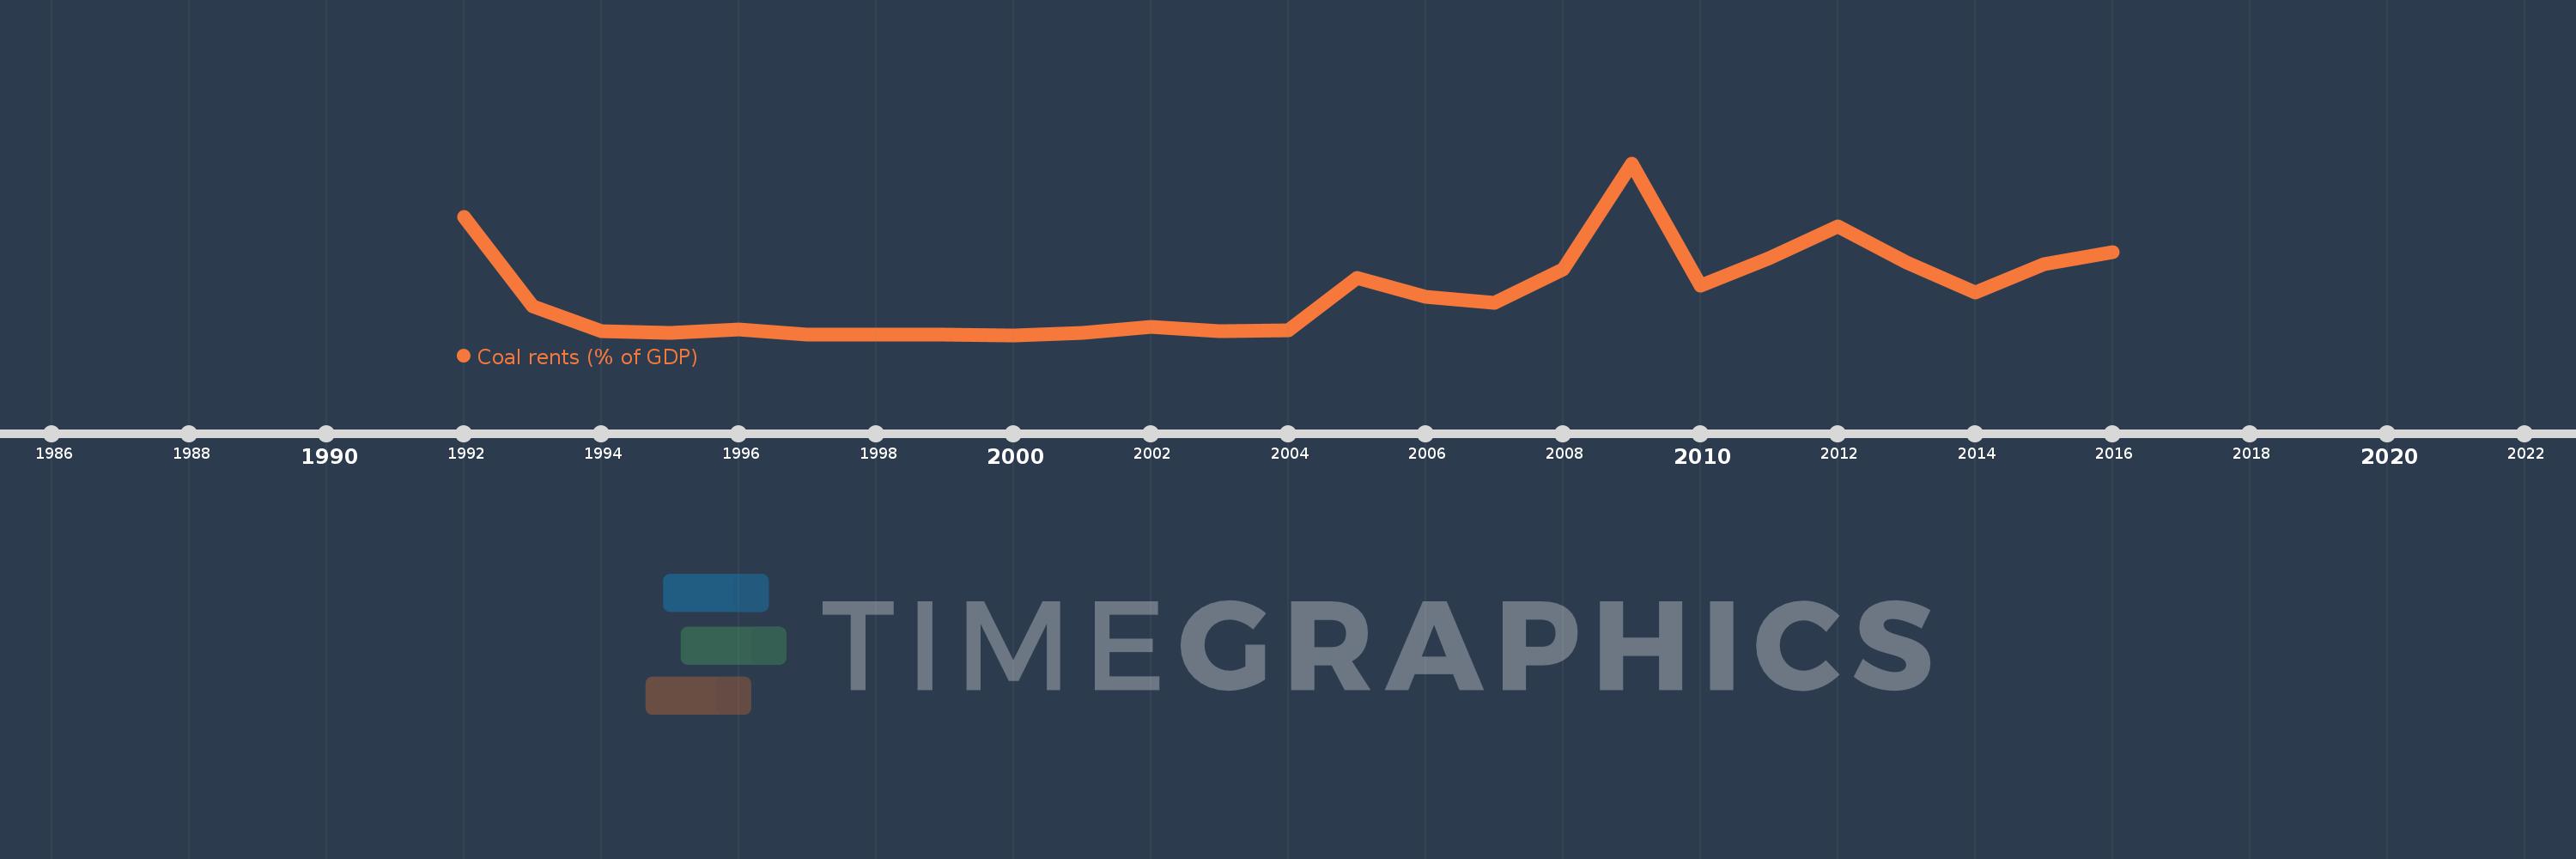
This timeline shows a graph from 1992 to 2016 of Tajikistan. No data until 1991. Number of actual observations by date: 25.
Source name:
World Development Indicators
Source organization:
Estimates based on sources and methods described in "The Changing Wealth of Nations: Measuring Sustainable Development in the New Millennium" (World Bank, 2011).
Categories, topics:
Environment
Last updated:
apr 23, 2017
Indicators value changes by year
Meaning:
0.05
Minimum:
0.0
jan 1, 2000
Maximum:
0.203
jan 1, 2009
At the date of observation
Value
Absolute change
Change from the previous value
jan 1, 1992
0.14
+0.14
0.0%
jan 1, 1993
0.034
-0.107
-76.06%
jan 1, 1994
0.005
-0.029
-86.1%
jan 1, 1995
0.003
-0.001
-31.3%
jan 1, 1996
0.007
+0.004
134.08%
jan 1, 1997
0.001
-0.006
-84.98%
jan 1, 1998
0.001
-0.001
-48.96%
jan 1, 1999
0.001
+0.0
9.79%
jan 1, 2000
0.0
0.0
-77.96%
jan 1, 2001
0.003
+0.003
1.98K%
jan 1, 2002
0.01
+0.007
244.96%
jan 1, 2003
0.005
-0.005
-51.42%
jan 1, 2004
0.006
+0.001
20.82%
jan 1, 2005
0.068
+0.062
1.07K%
jan 1, 2006
0.045
-0.023
-33.39%
jan 1, 2007
0.038
-0.007
-15.14%
jan 1, 2008
0.078
+0.039
101.96%
jan 1, 2009
0.203
+0.125
161.31%
jan 1, 2010
0.058
-0.145
-71.4%
jan 1, 2011
0.091
+0.033
56.04%
jan 1, 2012
0.128
+0.037
40.88%
jan 1, 2013
0.086
-0.041
-32.33%
jan 1, 2014
0.05
-0.037
-42.32%
jan 1, 2015
0.084
+0.034
67.81%
jan 1, 2016
0.098
+0.014
16.83%
Ranking of countries by current statistics by years