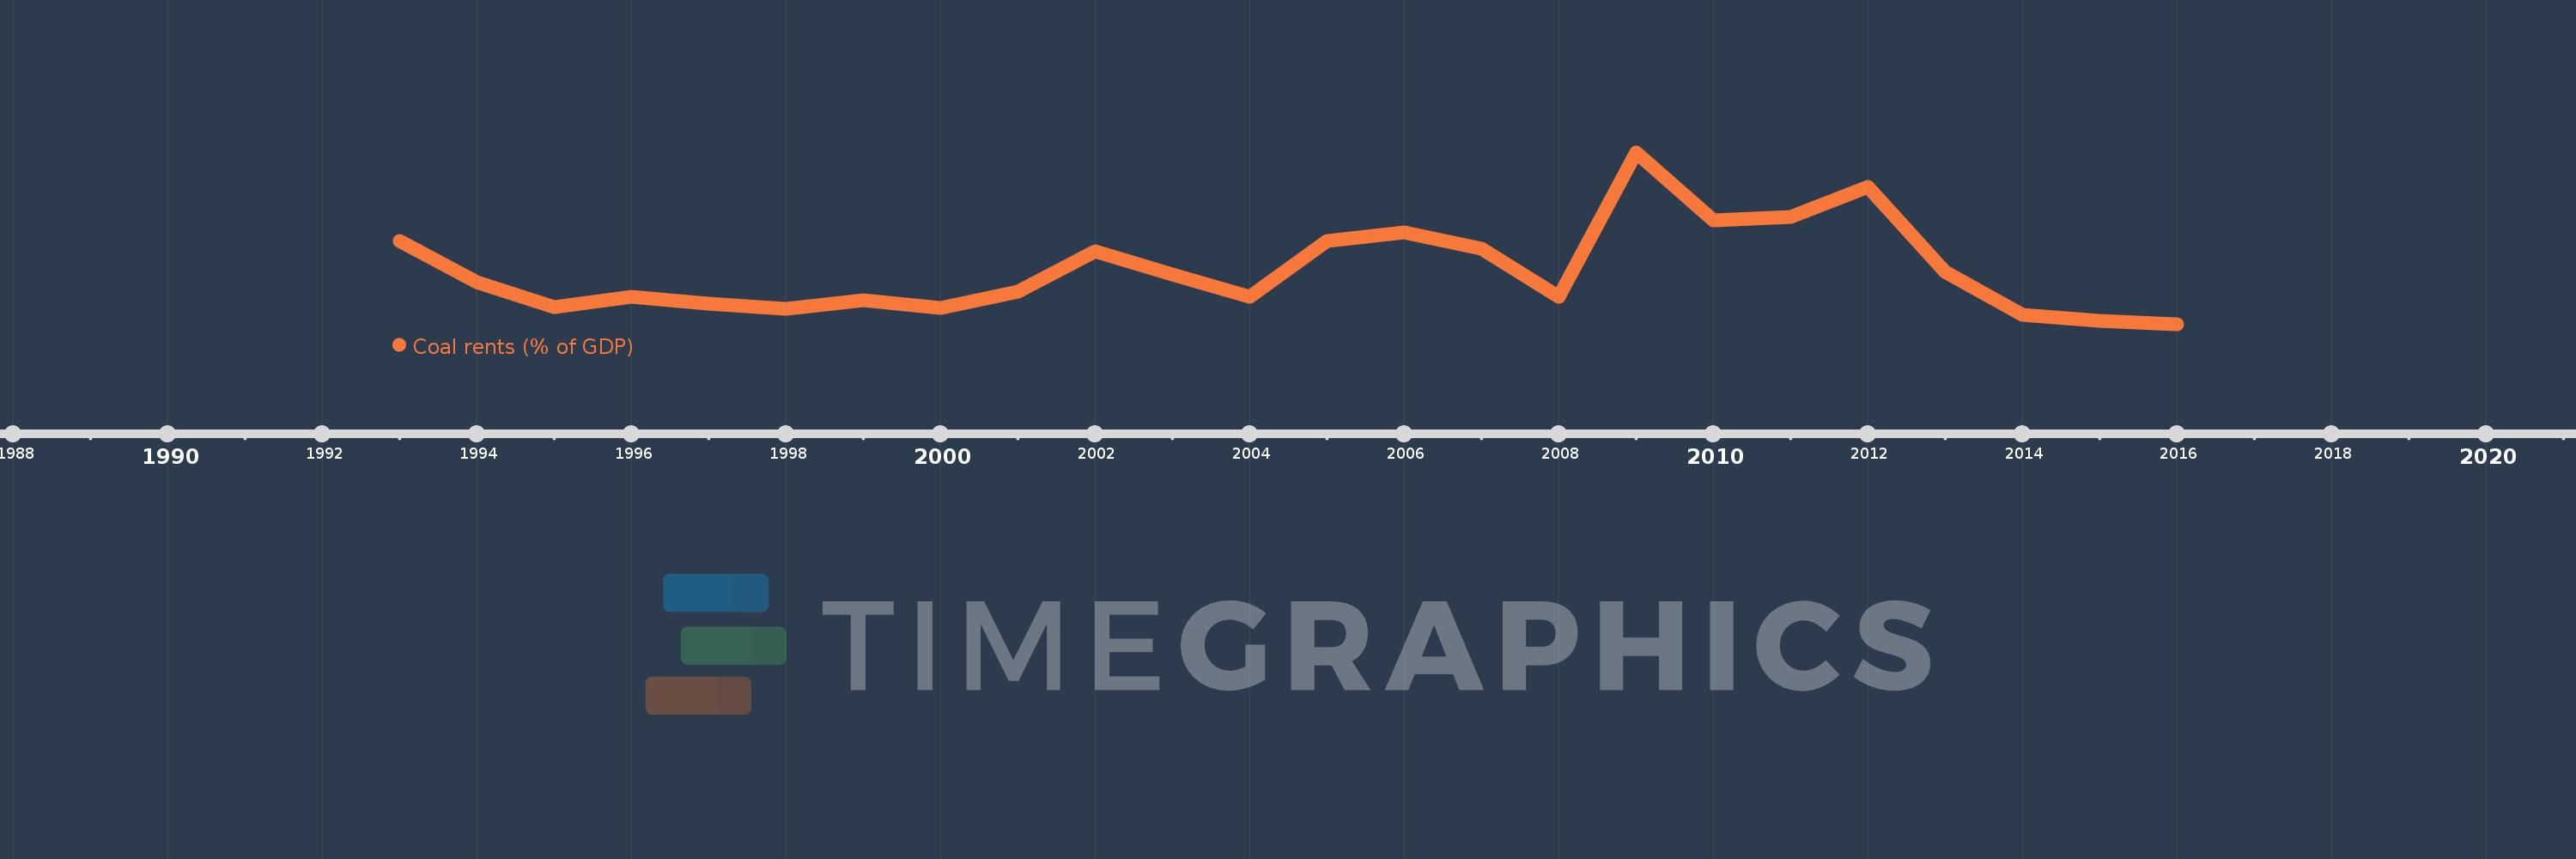
This timeline shows a graph from 1993 to 2016 of Ukraine. No data until 1992. Number of actual observations by date: 24.
Source name:
World Development Indicators
Source organization:
Estimates based on sources and methods described in "The Changing Wealth of Nations: Measuring Sustainable Development in the New Millennium" (World Bank, 2011).
Categories, topics:
Environment
Last updated:
apr 23, 2017
Indicators value changes by year
Meaning:
1.138
Minimum:
0.389
jan 1, 2016
Maximum:
2.78
jan 1, 2009
At the date of observation
Value
Absolute change
Change from the previous value
jan 1, 1993
1.551
+1.551
0.0%
jan 1, 1994
0.975
-0.575
-37.1%
jan 1, 1995
0.629
-0.347
-35.54%
jan 1, 1996
0.768
+0.139
22.17%
jan 1, 1997
0.672
-0.096
-12.49%
jan 1, 1998
0.599
-0.073
-10.84%
jan 1, 1999
0.727
+0.128
21.32%
jan 1, 2000
0.609
-0.119
-16.31%
jan 1, 2001
0.837
+0.228
37.51%
jan 1, 2002
1.399
+0.562
67.16%
jan 1, 2003
1.082
-0.317
-22.64%
jan 1, 2004
0.774
-0.308
-28.5%
jan 1, 2005
1.543
+0.769
99.37%
jan 1, 2006
1.669
+0.126
8.18%
jan 1, 2007
1.443
-0.226
-13.54%
jan 1, 2008
0.771
-0.672
-46.6%
jan 1, 2009
2.78
+2.01
260.83%
jan 1, 2010
1.838
-0.943
-33.91%
jan 1, 2011
1.884
+0.046
2.5%
jan 1, 2012
2.306
+0.423
22.44%
jan 1, 2013
1.118
-1.188
-51.53%
jan 1, 2014
0.524
-0.594
-53.12%
jan 1, 2015
0.43
-0.094
-17.91%
jan 1, 2016
0.389
-0.042
-9.66%
Ranking of countries by current statistics by years