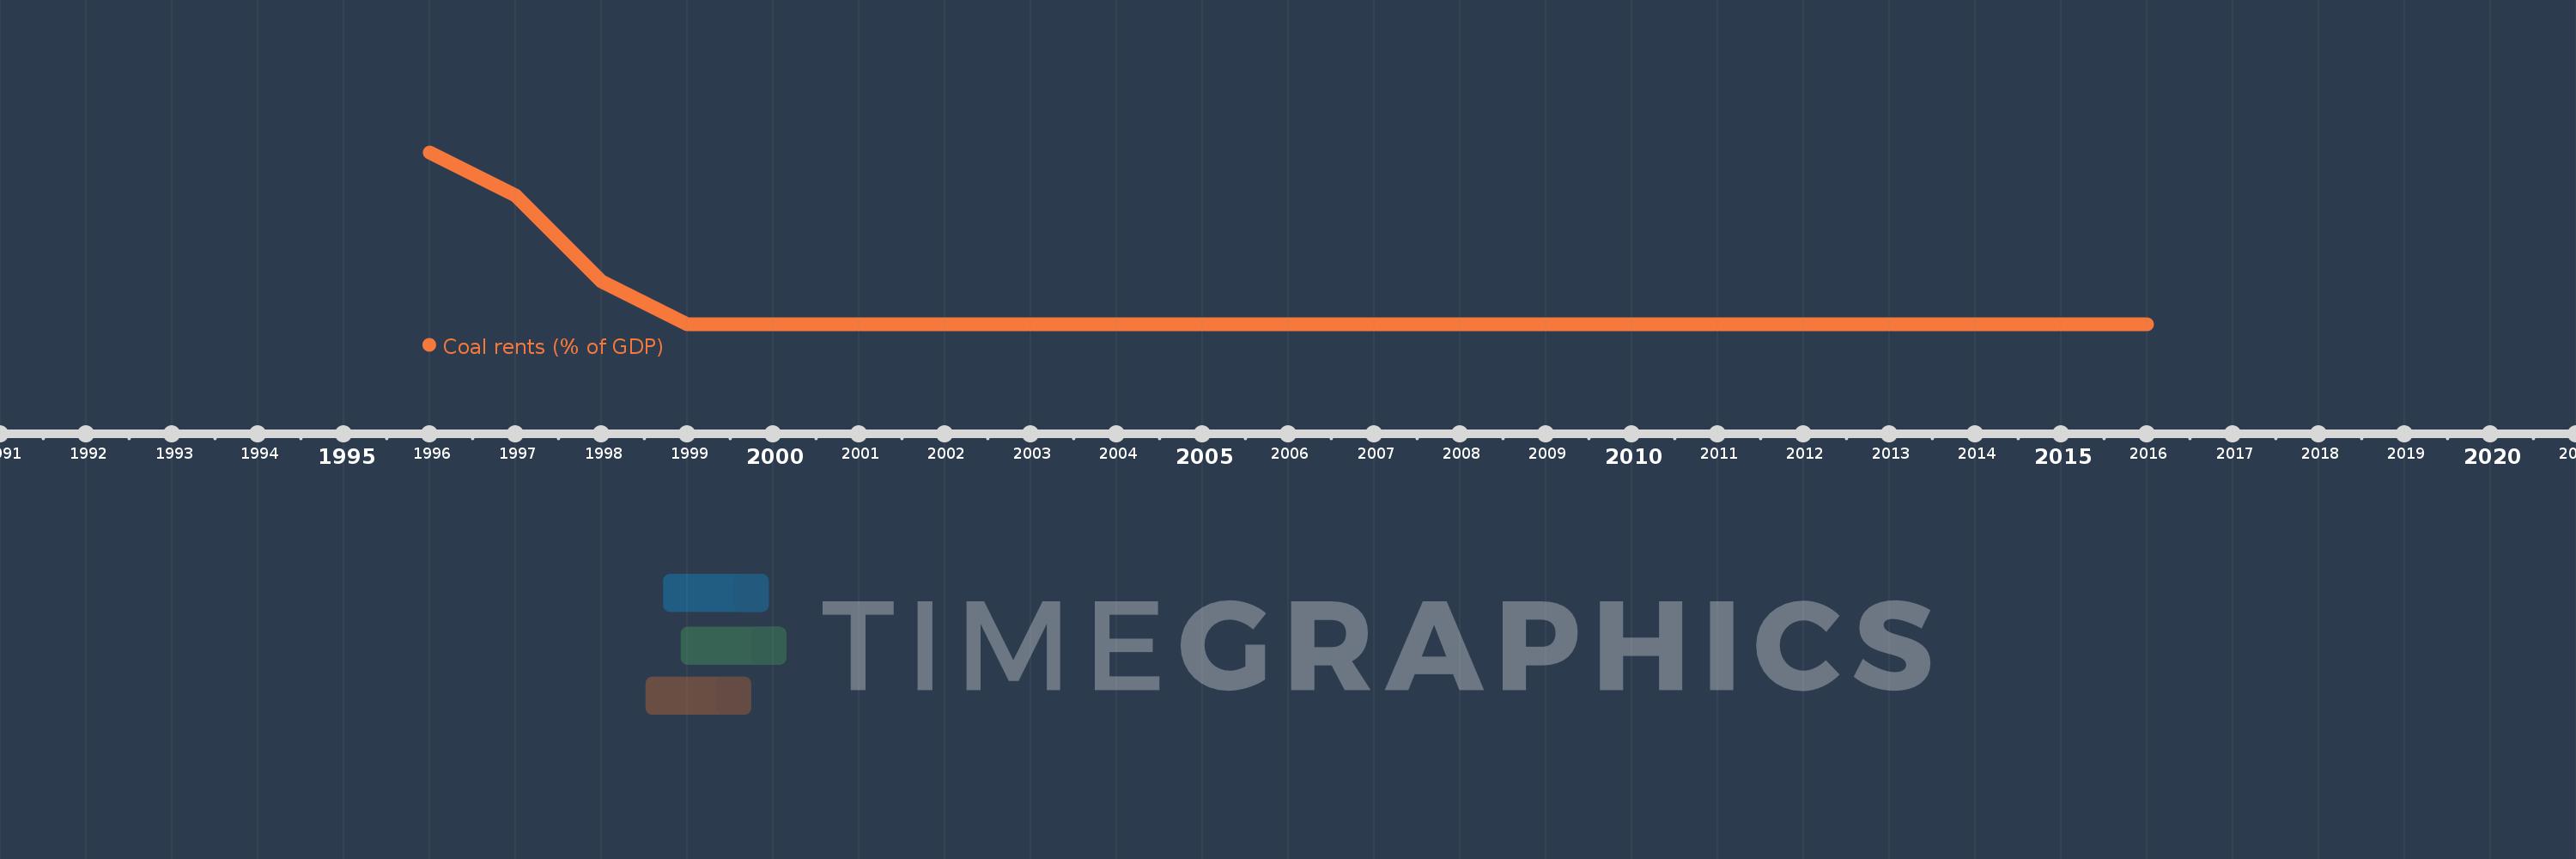
This timeline shows a graph from 1996 to 2016 of Moldova. No data until 1995. Number of actual observations by date: 21.
Source name:
World Development Indicators
Source organization:
Estimates based on sources and methods described in "The Changing Wealth of Nations: Measuring Sustainable Development in the New Millennium" (World Bank, 2011).
Categories, topics:
Environment
Last updated:
apr 23, 2017
Indicators value changes by year
Meaning:
0.0
Minimum:
0.0
jan 1, 2000
Maximum:
0.004
jan 1, 1996
At the date of observation
Value
Absolute change
Change from the previous value
jan 1, 1996
0.004
+0.004
0.0%
jan 1, 1997
0.003
-0.001
-28.78%
jan 1, 1998
0.001
-0.001
-45.04%
jan 1, 1999
0.0
-0.001
-81.59%
jan 1, 2000
0.0
0.0
-100.0%
jan 1, 2001
0.0
0.0
%
jan 1, 2002
0.0
0.0
%
jan 1, 2003
0.0
0.0
%
jan 1, 2004
0.0
0.0
%
jan 1, 2005
0.0
0.0
%
jan 1, 2006
0.0
0.0
%
jan 1, 2007
0.0
0.0
%
jan 1, 2008
0.0
0.0
%
jan 1, 2009
0.0
0.0
%
jan 1, 2010
0.0
0.0
%
jan 1, 2011
0.0
0.0
%
jan 1, 2012
0.0
0.0
%
jan 1, 2013
0.0
0.0
%
jan 1, 2014
0.0
0.0
%
jan 1, 2015
0.0
0.0
%
jan 1, 2016
0.0
0.0
%
Ranking of countries by current statistics by years