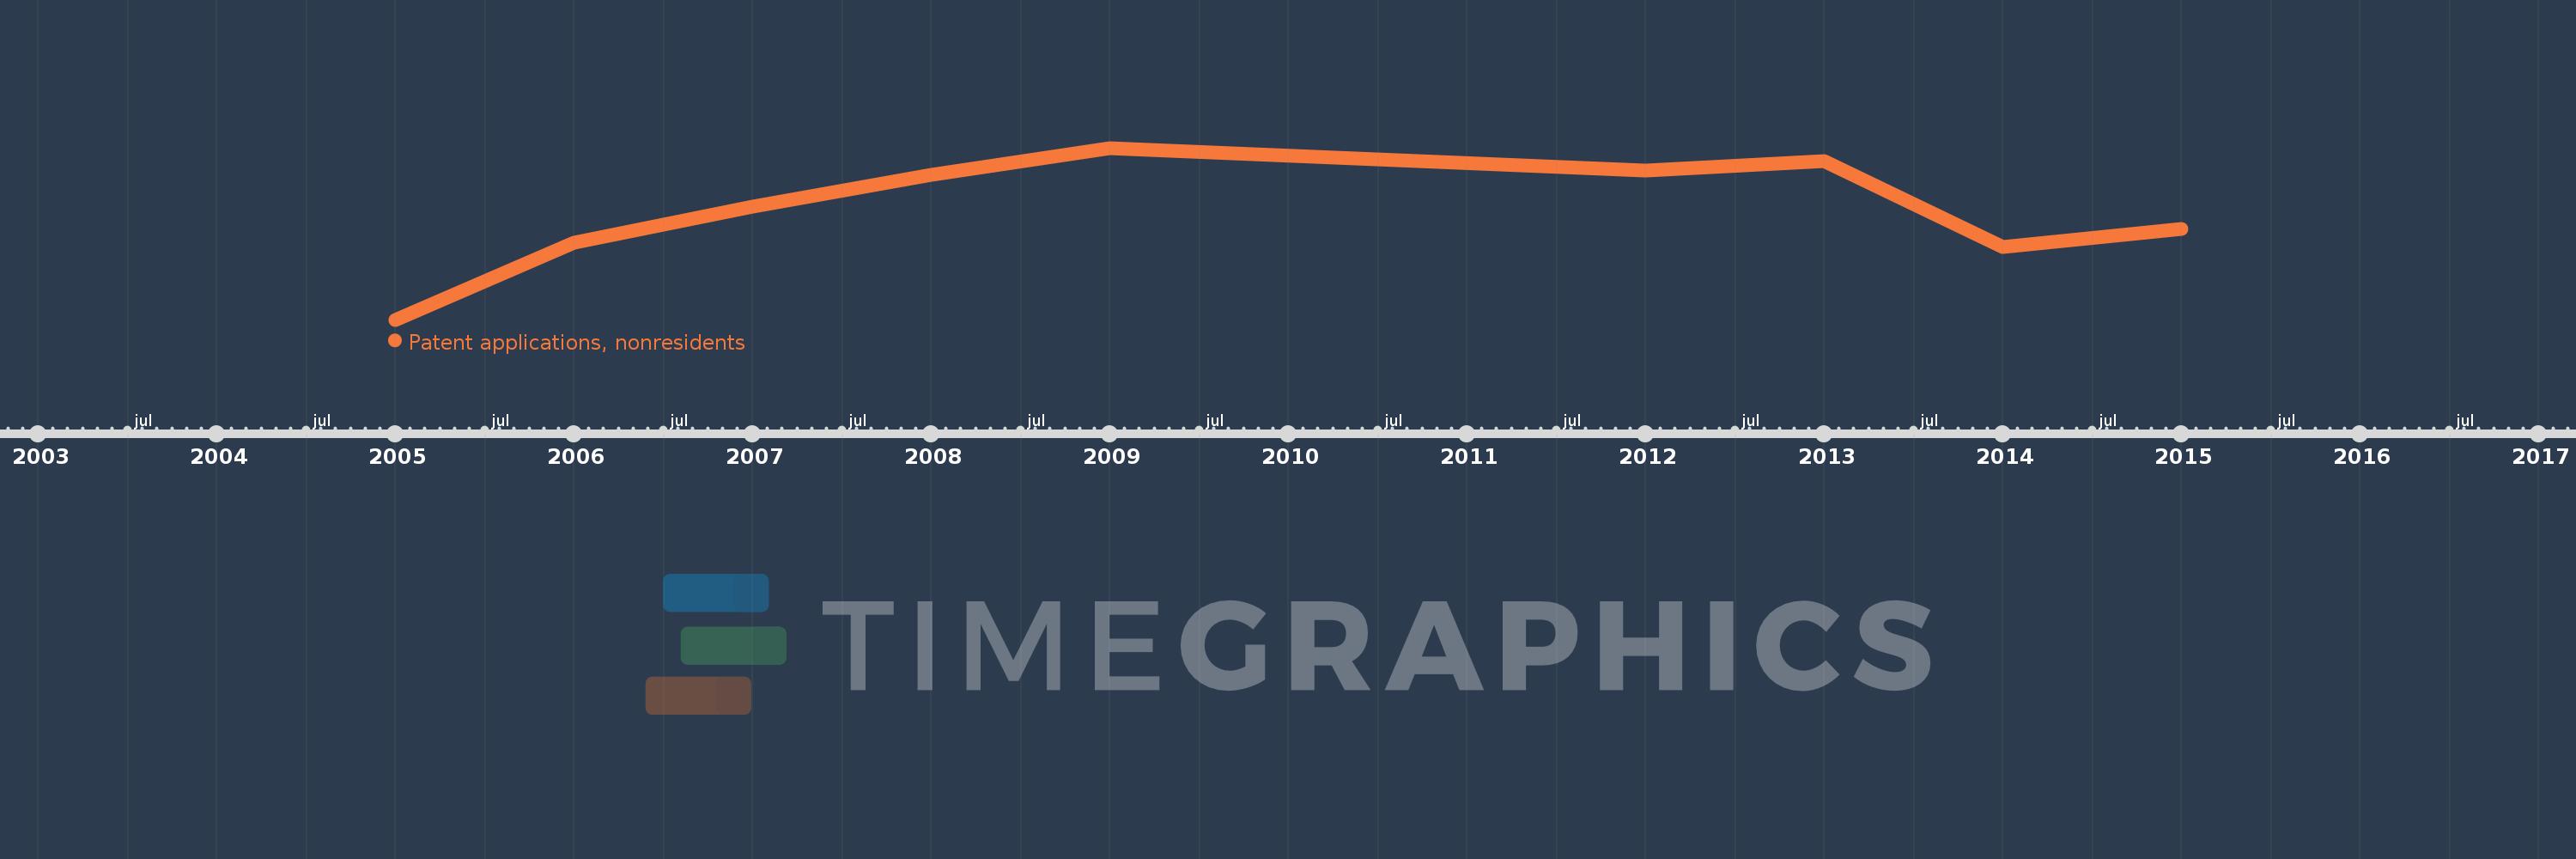
This timeline shows a graph from 2005 to 2015 of Belize. No data until 2004. Number of actual observations by date: 9.
Source name:
World Development Indicators
Source organization:
World Intellectual Property Organization (WIPO), WIPO Patent Report: Statistics on Worldwide Patent Activity. The International Bureau of WIPO assumes no responsibility with respect to the transformation of these data.
Categories, topics:
Science & Technology
Last updated:
apr 23, 2017
Indicators value changes by year
Meaning:
40.0
Minimum:
16.0
jan 1, 2005
Maximum:
54.0
jan 1, 2009
At the date of observation
Value
Absolute change
Change from the previous value
jan 1, 2005
16.0
+16.0
0.0%
jan 1, 2006
33.0
+17.0
106.25%
jan 1, 2007
41.0
+8.0
24.24%
jan 1, 2008
48.0
+7.0
17.07%
jan 1, 2009
54.0
+6.0
12.5%
jan 1, 2012
49.0
-5.0
-9.26%
jan 1, 2013
51.0
+2.0
4.08%
jan 1, 2014
32.0
-19.0
-37.25%
jan 1, 2015
36.0
+4.0
12.5%
Ranking of countries by current statistics by years