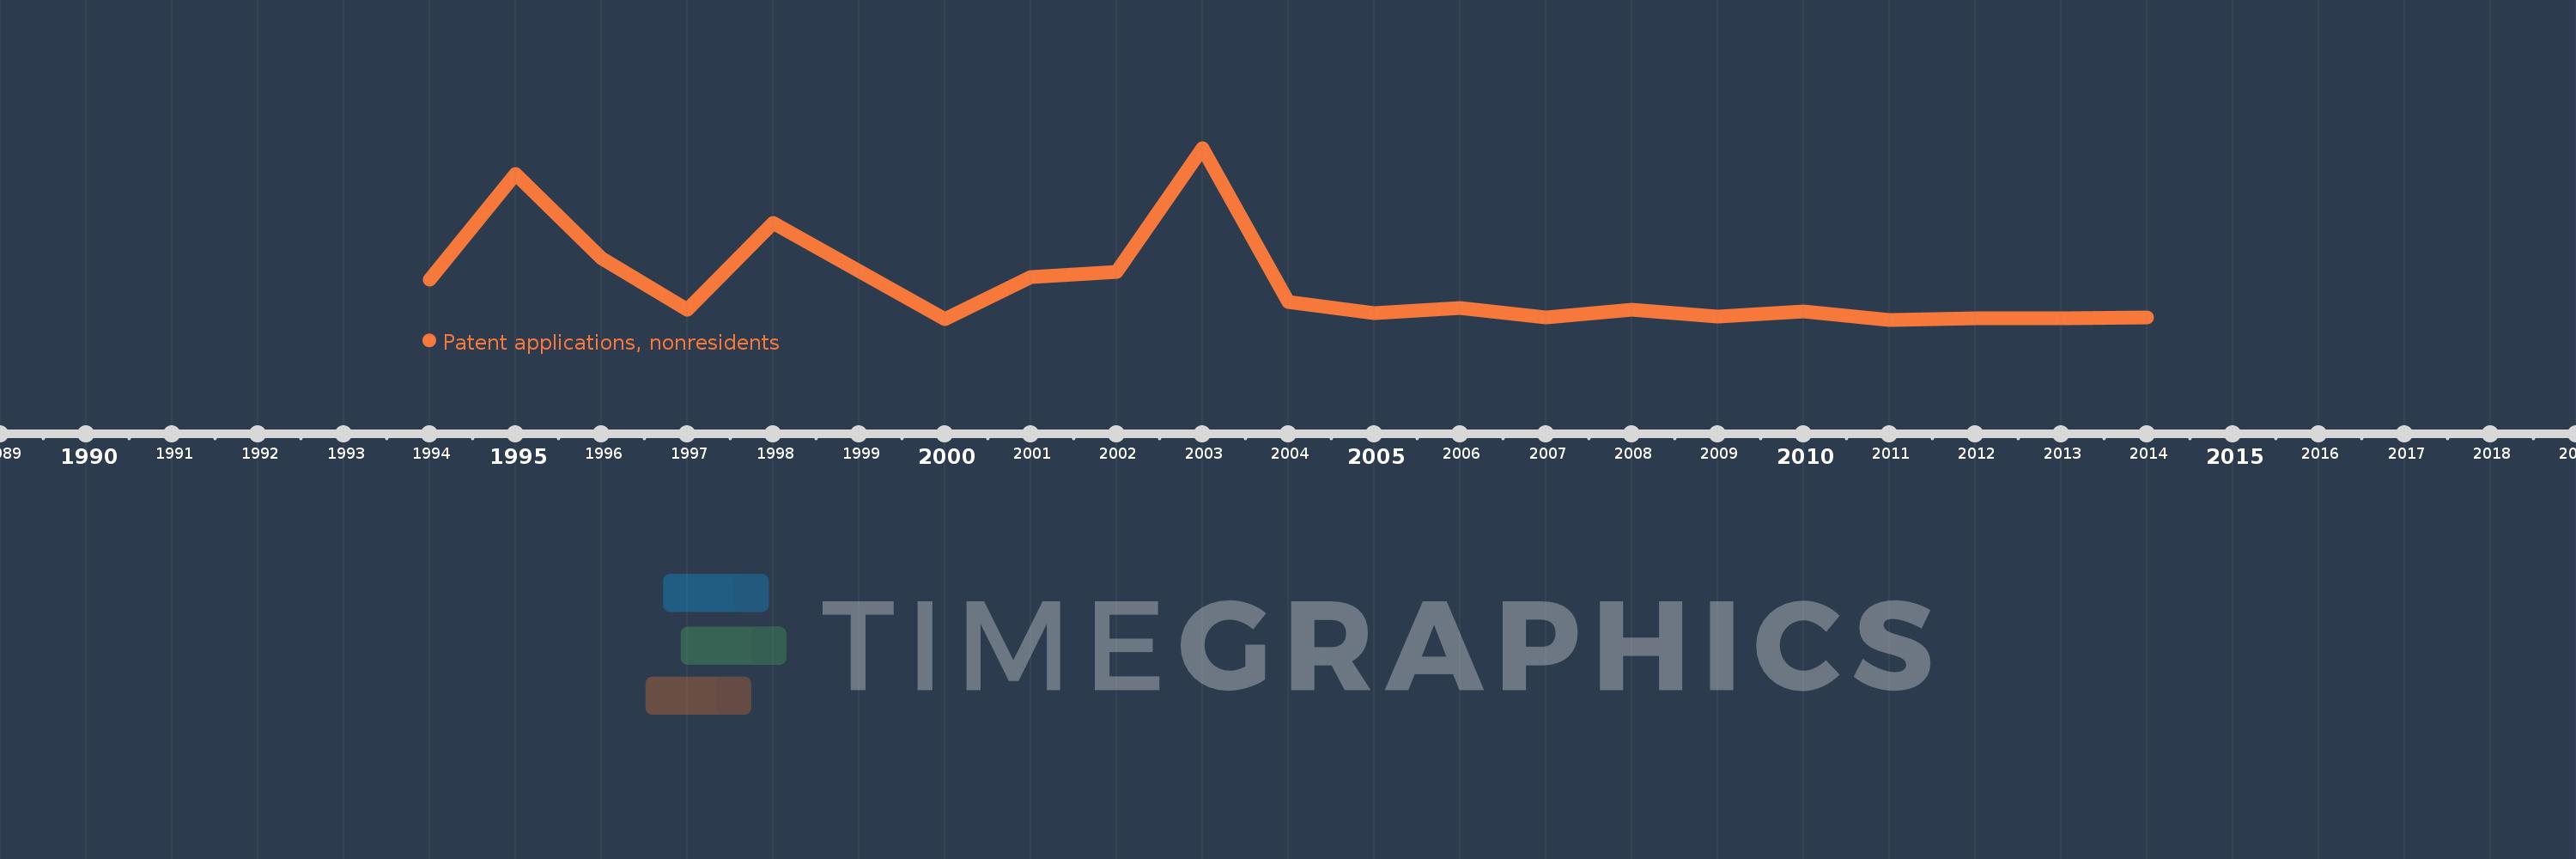
This timeline shows a graph from 1994 to 2014 of Macedonia, FYR. No data until 1993. Number of actual observations by date: 21.
Source name:
World Development Indicators
Source organization:
World Intellectual Property Organization (WIPO), WIPO Patent Report: Statistics on Worldwide Patent Activity. The International Bureau of WIPO assumes no responsibility with respect to the transformation of these data.
Categories, topics:
Science & Technology
Last updated:
apr 23, 2017
Indicators value changes by year
Meaning:
43.286
Minimum:
1.0
jan 1, 2011
Maximum:
209.0
jan 1, 2003
At the date of observation
Value
Absolute change
Change from the previous value
jan 1, 1994
50.0
+50.0
0.0%
jan 1, 1995
178.0
+128.0
256.0%
jan 1, 1996
76.0
-102.0
-57.3%
jan 1, 1997
13.0
-63.0
-82.89%
jan 1, 1998
118.0
+105.0
807.69%
jan 1, 1999
60.0
-58.0
-49.15%
jan 1, 2000
2.0
-58.0
-96.67%
jan 1, 2001
53.0
+51.0
2.55K%
jan 1, 2002
59.0
+6.0
11.32%
jan 1, 2003
209.0
+150.0
254.24%
jan 1, 2004
23.0
-186.0
-89.0%
jan 1, 2005
9.0
-14.0
-60.87%
jan 1, 2006
15.0
+6.0
66.67%
jan 1, 2007
4.0
-11.0
-73.33%
jan 1, 2008
13.0
+9.0
225.0%
jan 1, 2009
5.0
-8.0
-61.54%
jan 1, 2010
11.0
+6.0
120.0%
jan 1, 2011
1.0
-10.0
-90.91%
jan 1, 2012
3.0
+2.0
200.0%
jan 1, 2013
3.0
0.0
0.0%
jan 1, 2014
4.0
+1.0
33.33%
Ranking of countries by current statistics by years