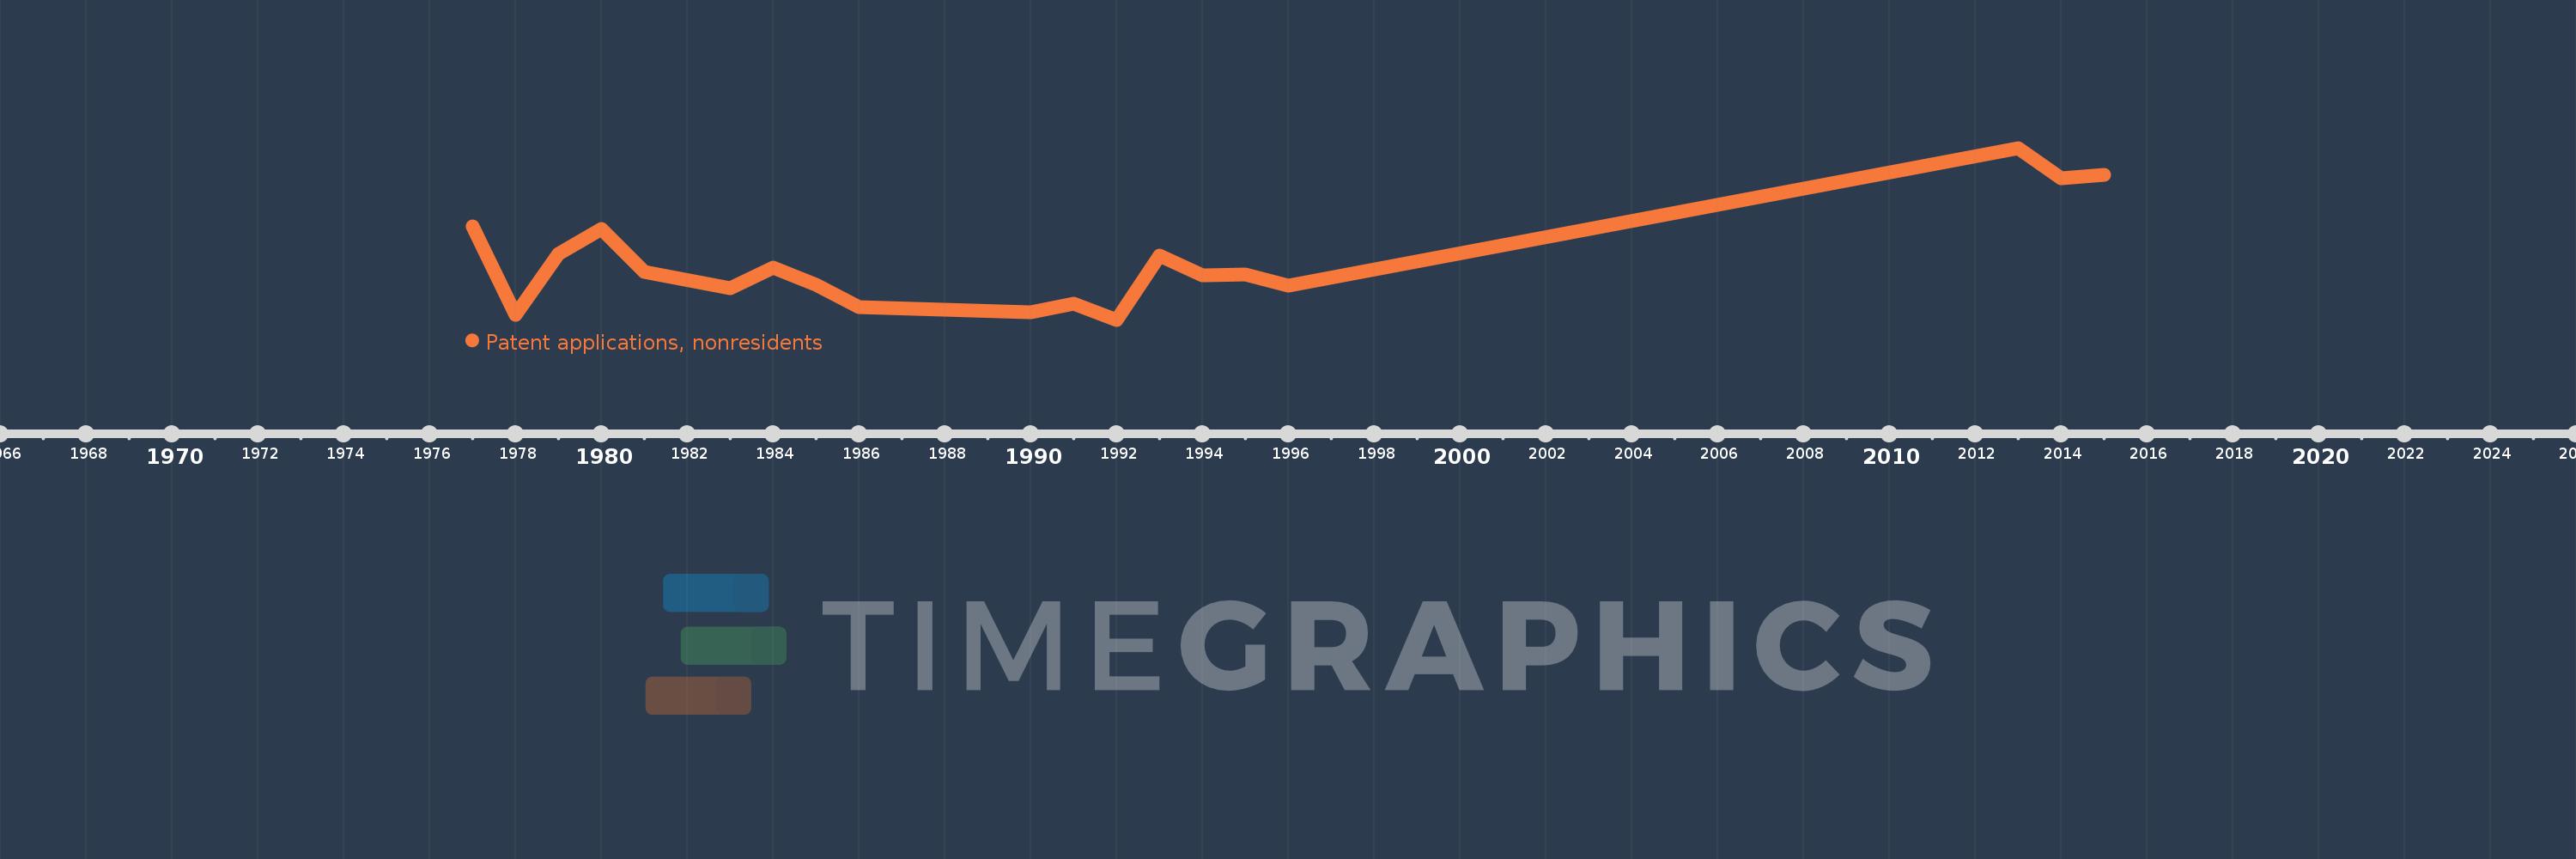
This timeline shows a graph from 1977 to 2015 of El Salvador. No data until 1976. Number of actual observations by date: 19.
Source name:
World Development Indicators
Source organization:
World Intellectual Property Organization (WIPO), WIPO Patent Report: Statistics on Worldwide Patent Activity. The International Bureau of WIPO assumes no responsibility with respect to the transformation of these data.
Categories, topics:
Science & Technology
Last updated:
apr 23, 2017
Indicators value changes by year
Meaning:
90.474
Minimum:
26.0
jan 1, 1992
Maximum:
217.0
jan 1, 2013
At the date of observation
Value
Absolute change
Change from the previous value
jan 1, 1977
130.0
+130.0
0.0%
jan 1, 1978
31.0
-99.0
-76.15%
jan 1, 1979
99.0
+68.0
219.35%
jan 1, 1980
127.0
+28.0
28.28%
jan 1, 1981
79.0
-48.0
-37.8%
jan 1, 1983
61.0
-18.0
-22.78%
jan 1, 1984
84.0
+23.0
37.7%
jan 1, 1985
65.0
-19.0
-22.62%
jan 1, 1986
40.0
-25.0
-38.46%
jan 1, 1990
34.0
-6.0
-15.0%
jan 1, 1991
44.0
+10.0
29.41%
jan 1, 1992
26.0
-18.0
-40.91%
jan 1, 1993
97.0
+71.0
273.08%
jan 1, 1994
75.0
-22.0
-22.68%
jan 1, 1995
76.0
+1.0
1.33%
jan 1, 1996
64.0
-12.0
-15.79%
jan 1, 2013
217.0
+153.0
239.06%
jan 1, 2014
183.0
-34.0
-15.67%
jan 1, 2015
187.0
+4.0
2.19%
Ranking of countries by current statistics by years