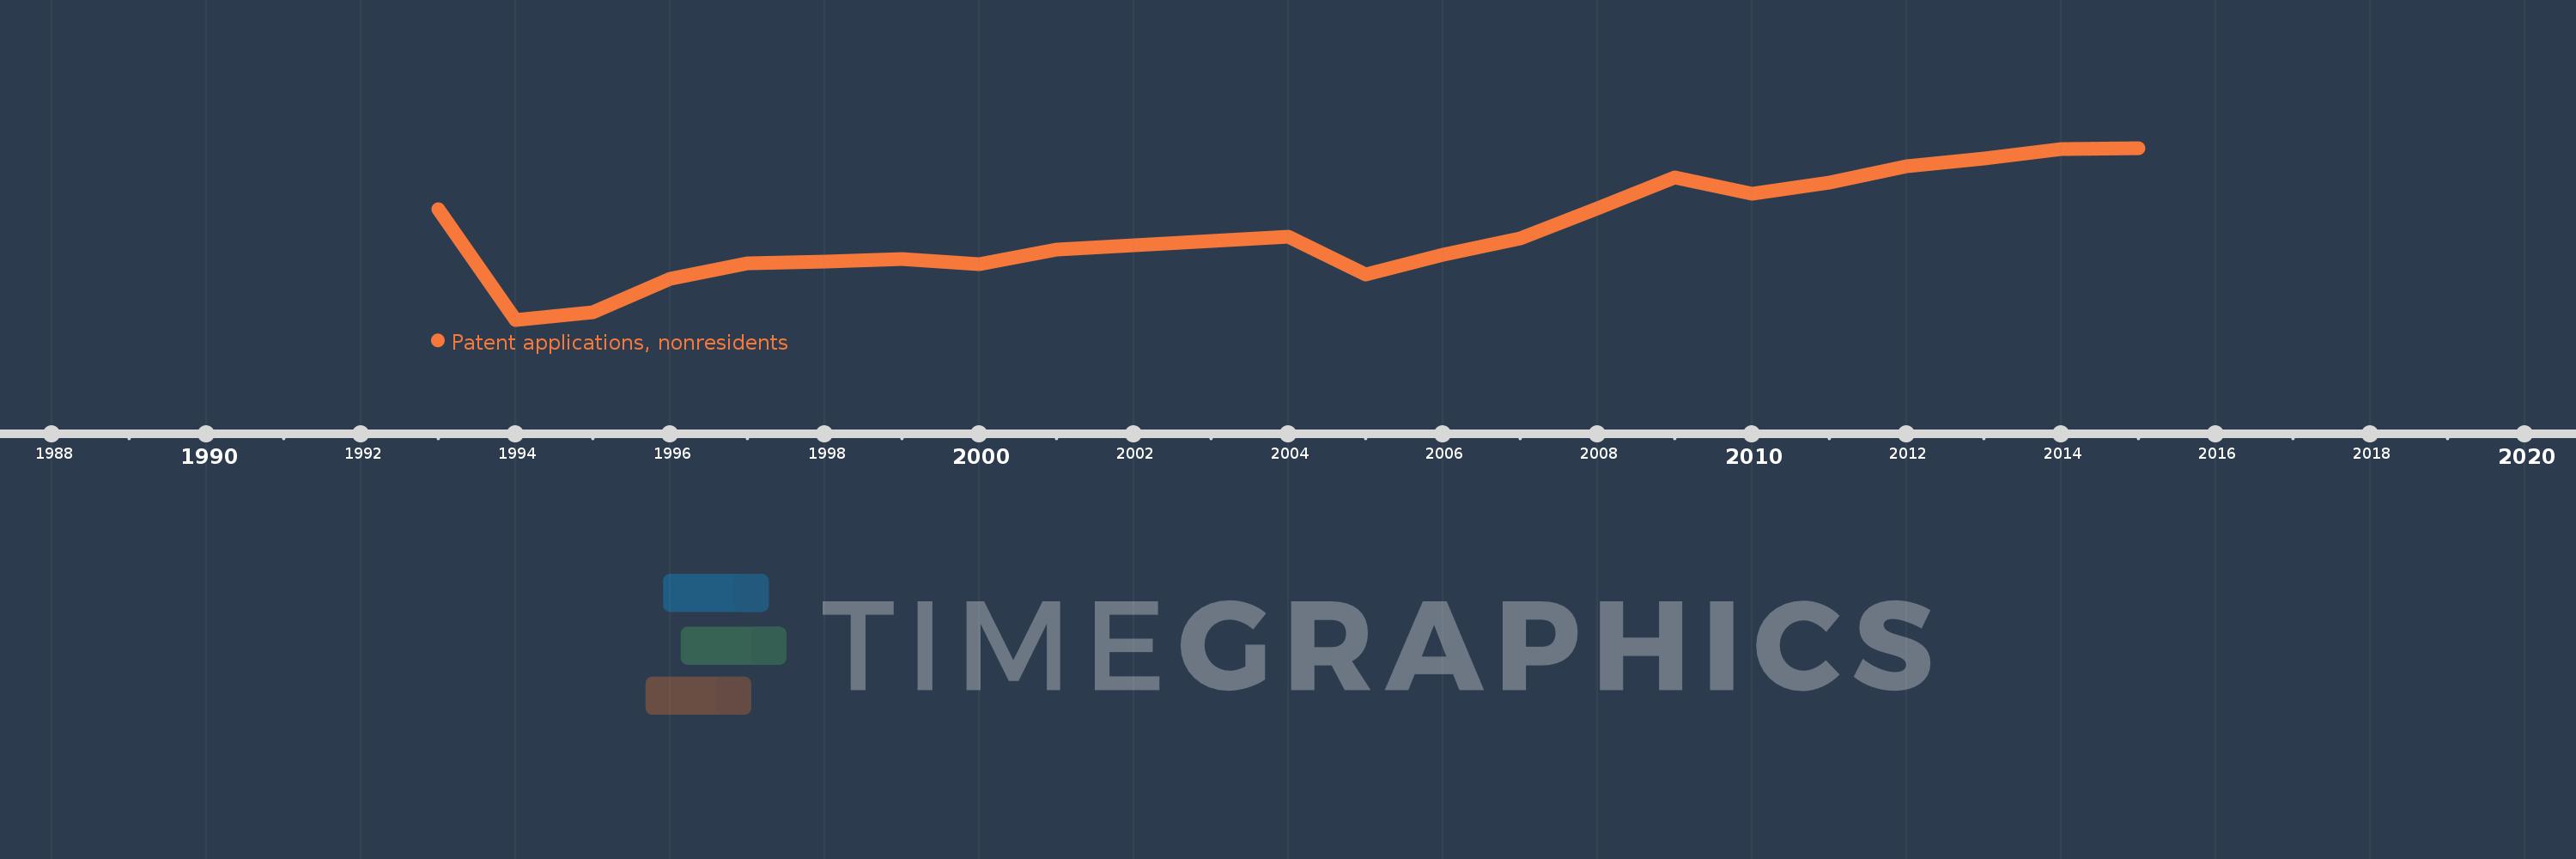
This timeline shows a graph from 1993 to 2015 of Russian Federation. No data until 1992. Number of actual observations by date: 23.
Source name:
World Development Indicators
Source organization:
World Intellectual Property Organization (WIPO), WIPO Patent Report: Statistics on Worldwide Patent Activity. The International Bureau of WIPO assumes no responsibility with respect to the transformation of these data.
Categories, topics:
Science & Technology
Last updated:
apr 23, 2017
Indicators value changes by year
Meaning:
10.373K
Minimum:
3.974K
jan 1, 1994
Maximum:
16.236K
jan 1, 2015
At the date of observation
Value
Absolute change
Change from the previous value
jan 1, 1993
11.85K
+11.85K
0.0%
jan 1, 1994
3.974K
-7.876K
-66.46%
jan 1, 1995
4.495K
+521.0
13.11%
jan 1, 1996
6.893K
+2.398K
53.35%
jan 1, 1997
7.98K
+1.087K
15.77%
jan 1, 1998
8.123K
+143.0
1.79%
jan 1, 1999
8.299K
+176.0
2.17%
jan 1, 2000
7.944K
-355.0
-4.28%
jan 1, 2001
8.96K
+1.016K
12.79%
jan 1, 2002
9.313K
+353.0
3.94%
jan 1, 2003
9.596K
+283.0
3.04%
jan 1, 2004
9.901K
+305.0
3.18%
jan 1, 2005
7.205K
-2.696K
-27.23%
jan 1, 2006
8.609K
+1.404K
19.49%
jan 1, 2007
9.807K
+1.198K
13.92%
jan 1, 2008
11.934K
+2.127K
21.69%
jan 1, 2009
14.137K
+2.203K
18.46%
jan 1, 2010
12.966K
-1.171K
-8.28%
jan 1, 2011
13.778K
+812.0
6.26%
jan 1, 2012
14.919K
+1.141K
8.28%
jan 1, 2013
15.51K
+591.0
3.96%
jan 1, 2014
16.149K
+639.0
4.12%
jan 1, 2015
16.236K
+87.0
0.54%
Ranking of countries by current statistics by years