33
/
AIzaSyAYiBZKx7MnpbEhh9jyipgxe19OcubqV5w
May 1, 2025
150849
Honduras
HND
true
2
1
Patent applications, nonresidents
2014,2013,2012,2003,2002,2001,2000,1997,1996,1993,1991,1989,1988,1986,1985,1984,1983,1981,1979,1978,1977,1975,1974,1973,1972
Download
Global statistics library →Honduras →

Patent applications, nonresidents

This statistics in other country:

AlbaniaAlgeriaAngolaAntigua and BarbudaArab WorldArgentinaArmeniaAustraliaAustriaAzerbaijanBahamas, TheBahrainBangladeshBarbadosBelarusBelgiumBelizeBhutanBoliviaBosnia and HerzegovinaBotswanaBrazilBrunei DarussalamBulgariaBurundiCambodiaCanadaCaribbean small statesCentral Europe and the BalticsChileChinaColombiaCongo, Dem. Rep.Congo, Rep.Costa RicaCote d'IvoireCroatiaCubaCyprusCzech RepublicDenmarkDjiboutiDominicaDominican RepublicEarly-demographic dividendEast Asia & PacificEast Asia & Pacific (excluding high income)East Asia & Pacific (IDA & IBRD countries)EcuadorEgypt, Arab Rep.El SalvadorEstoniaEthiopiaEuro areaEurope & Central AsiaEurope & Central Asia (excluding high income)Europe & Central Asia (IDA & IBRD countries)European UnionFijiFinlandFranceGambia, TheGeorgiaGermanyGhanaGreeceGrenadaGuatemalaGuyanaHaitiHigh incomeHondurasHong Kong SAR, ChinaHungaryIBRD onlyIcelandIDA & IBRD totalIDA blendIndiaIndonesiaIran, Islamic Rep.IraqIrelandIsraelItalyJamaicaJapanJordanKazakhstanKenyaKiribatiKorea, Dem. People’s Rep.Korea, Rep.KuwaitKyrgyz RepublicLao PDRLate-demographic dividendLatin America & Caribbean Latin America & Caribbean (excluding high income)Latin America & the Caribbean (IDA & IBRD countries)LatviaLebanonLesothoLiberiaLibyaLithuaniaLow & middle incomeLower middle incomeLuxembourgMacao SAR, ChinaMacedonia, FYRMadagascarMalawiMalaysiaMaliMaltaMauritiusMexicoMiddle East & North AfricaMiddle East & North Africa (excluding high income)Middle East & North Africa (IDA & IBRD countries)Middle incomeMoldovaMonacoMongoliaMontenegroMoroccoMozambiqueNamibiaNepalNetherlandsNew ZealandNicaraguaNigeriaNorth AmericaNorwayOECD membersPacific island small statesPakistanPanamaPapua New GuineaParaguayPeruPhilippinesPolandPortugalPost-demographic dividendQatarRomaniaRussian FederationRwandaSamoaSao Tome and PrincipeSaudi ArabiaSerbiaSeychellesSierra LeoneSingaporeSlovak RepublicSloveniaSolomon IslandsSomaliaSouth AfricaSouth AsiaSouth Asia (IDA & IBRD)SpainSri LankaSt. LuciaSt. Vincent and the GrenadinesSudanSwazilandSwedenSwitzerlandSyrian Arab RepublicTajikistanTanzaniaThailandTrinidad and TobagoTunisiaTurkeyTurkmenistanUgandaUkraineUnited Arab EmiratesUnited KingdomUnited StatesUpper middle incomeUruguayUzbekistanVenezuela, RBVietnamWorldYemen, Rep.ZambiaZimbabwe

Timeline:

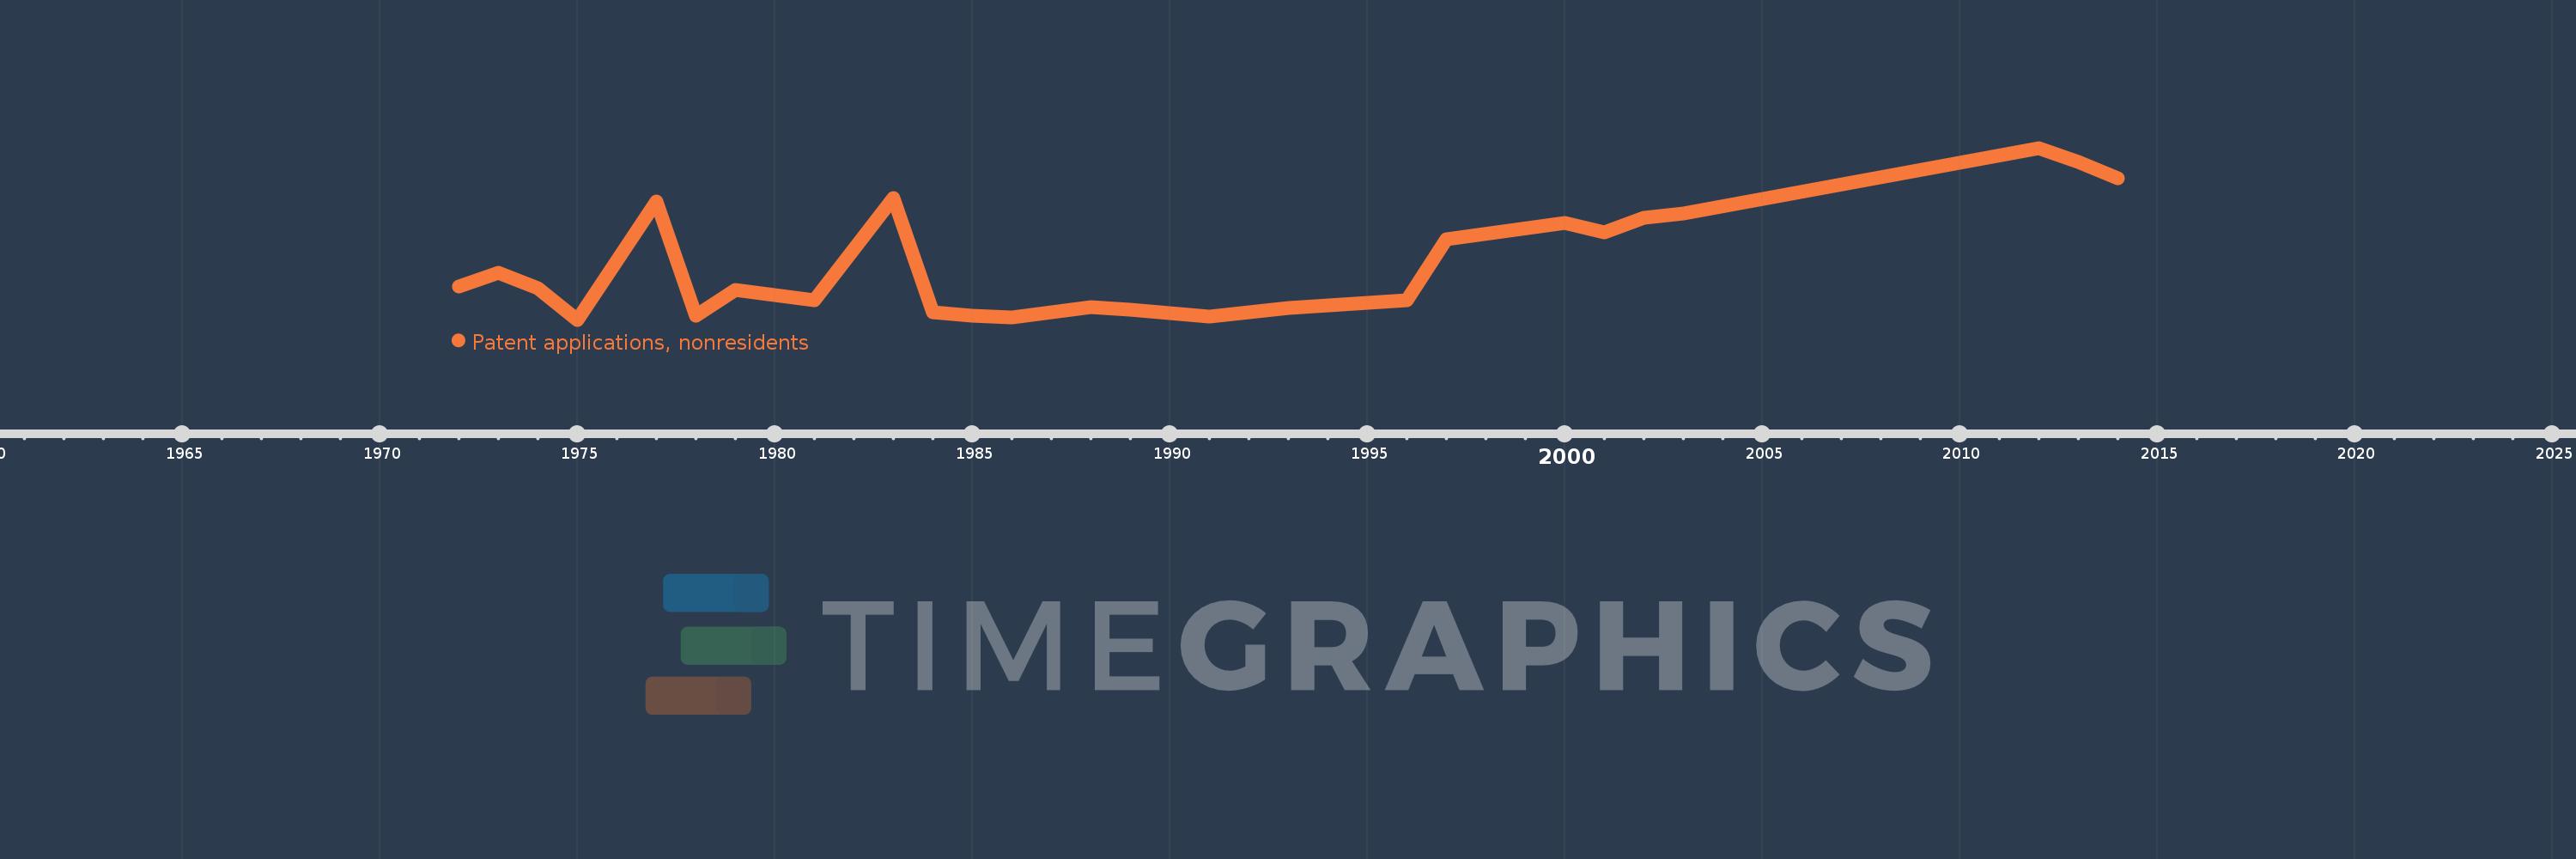
This timeline shows a graph from 1972 to 2014 of Honduras. No data until 1971. Number of actual observations by date: 25.

Source name:

World Development Indicators

Source organization:

World Intellectual Property Organization (WIPO), WIPO Patent Report: Statistics on Worldwide Patent Activity. The International Bureau of WIPO assumes no responsibility with respect to the transformation of these data.

Categories, topics:

Science & Technology

Last updated:

apr 23, 2017

Indicators value changes by year

Meaning:
92.36
Minimum:
13.0
jan 1, 1975
Maximum:
253.0
jan 1, 2012
At the date of observation
Value
Absolute change
Change from the previous value
jan 1, 1972
59.0
+59.0
0.0%
jan 1, 1973
79.0
+20.0
33.9%
jan 1, 1974
57.0
-22.0
-27.85%
jan 1, 1975
13.0
-44.0
-77.19%
jan 1, 1977
178.0
+165.0
1.27K%
jan 1, 1978
19.0
-159.0
-89.33%
jan 1, 1979
55.0
+36.0
189.47%
jan 1, 1981
40.0
-15.0
-27.27%
jan 1, 1983
183.0
+143.0
357.5%
jan 1, 1984
24.0
-159.0
-86.89%
jan 1, 1985
19.0
-5.0
-20.83%
jan 1, 1986
16.0
-3.0
-15.79%
jan 1, 1988
31.0
+15.0
93.75%
jan 1, 1989
27.0
-4.0
-12.9%
jan 1, 1991
17.0
-10.0
-37.04%
jan 1, 1993
30.0
+13.0
76.47%
jan 1, 1996
40.0
+10.0
33.33%
jan 1, 1997
126.0
+86.0
215.0%
jan 1, 2000
148.0
+22.0
17.46%
jan 1, 2001
135.0
-13.0
-8.78%
jan 1, 2002
155.0
+20.0
14.81%
jan 1, 2003
161.0
+6.0
3.87%
jan 1, 2012
253.0
+92.0
57.14%
jan 1, 2013
233.0
-20.0
-7.91%
jan 1, 2014
211.0
-22.0
-9.44%

Ranking of countries by current statistics by years