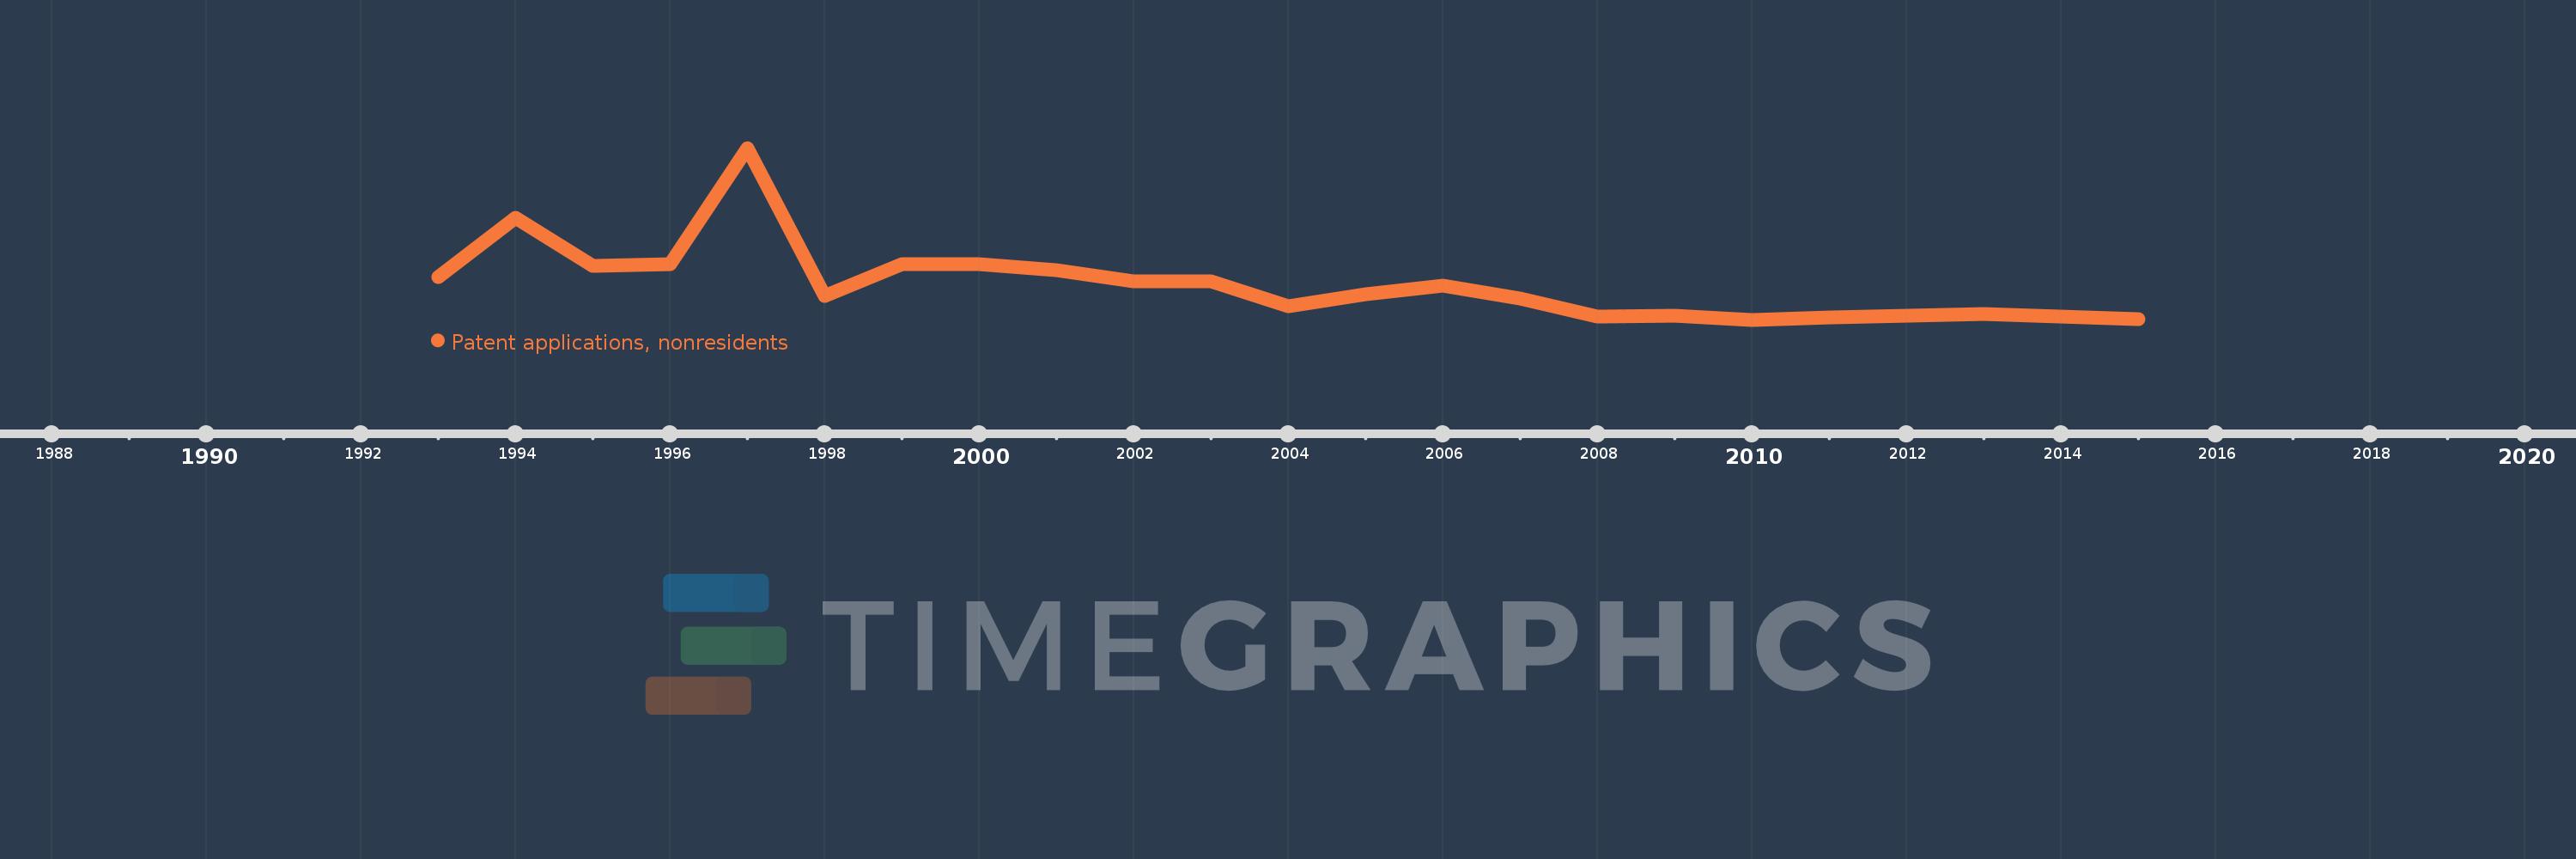
This timeline shows a graph from 1993 to 2015 of Latvia. No data until 1992. Number of actual observations by date: 23.
Source name:
World Development Indicators
Source organization:
World Intellectual Property Organization (WIPO), WIPO Patent Report: Statistics on Worldwide Patent Activity. The International Bureau of WIPO assumes no responsibility with respect to the transformation of these data.
Categories, topics:
Science & Technology
Last updated:
apr 23, 2017
Indicators value changes by year
Meaning:
58.0
Minimum:
3.0
jan 1, 2010
Maximum:
273.0
jan 1, 1997
At the date of observation
Value
Absolute change
Change from the previous value
jan 1, 1993
70.0
+70.0
0.0%
jan 1, 1994
163.0
+93.0
132.86%
jan 1, 1995
87.0
-76.0
-46.63%
jan 1, 1996
90.0
+3.0
3.45%
jan 1, 1997
273.0
+183.0
203.33%
jan 1, 1998
40.0
-233.0
-85.35%
jan 1, 1999
90.0
+50.0
125.0%
jan 1, 2000
91.0
+1.0
1.11%
jan 1, 2001
81.0
-10.0
-10.99%
jan 1, 2002
63.0
-18.0
-22.22%
jan 1, 2003
64.0
+1.0
1.59%
jan 1, 2004
24.0
-40.0
-62.5%
jan 1, 2005
43.0
+19.0
79.17%
jan 1, 2006
57.0
+14.0
32.56%
jan 1, 2007
37.0
-20.0
-35.09%
jan 1, 2008
8.0
-29.0
-78.38%
jan 1, 2009
9.0
+1.0
12.5%
jan 1, 2010
3.0
-6.0
-66.67%
jan 1, 2011
7.0
+4.0
133.33%
jan 1, 2012
10.0
+3.0
42.86%
jan 1, 2013
12.0
+2.0
20.0%
jan 1, 2014
8.0
-4.0
-33.33%
jan 1, 2015
4.0
-4.0
-50.0%
Ranking of countries by current statistics by years