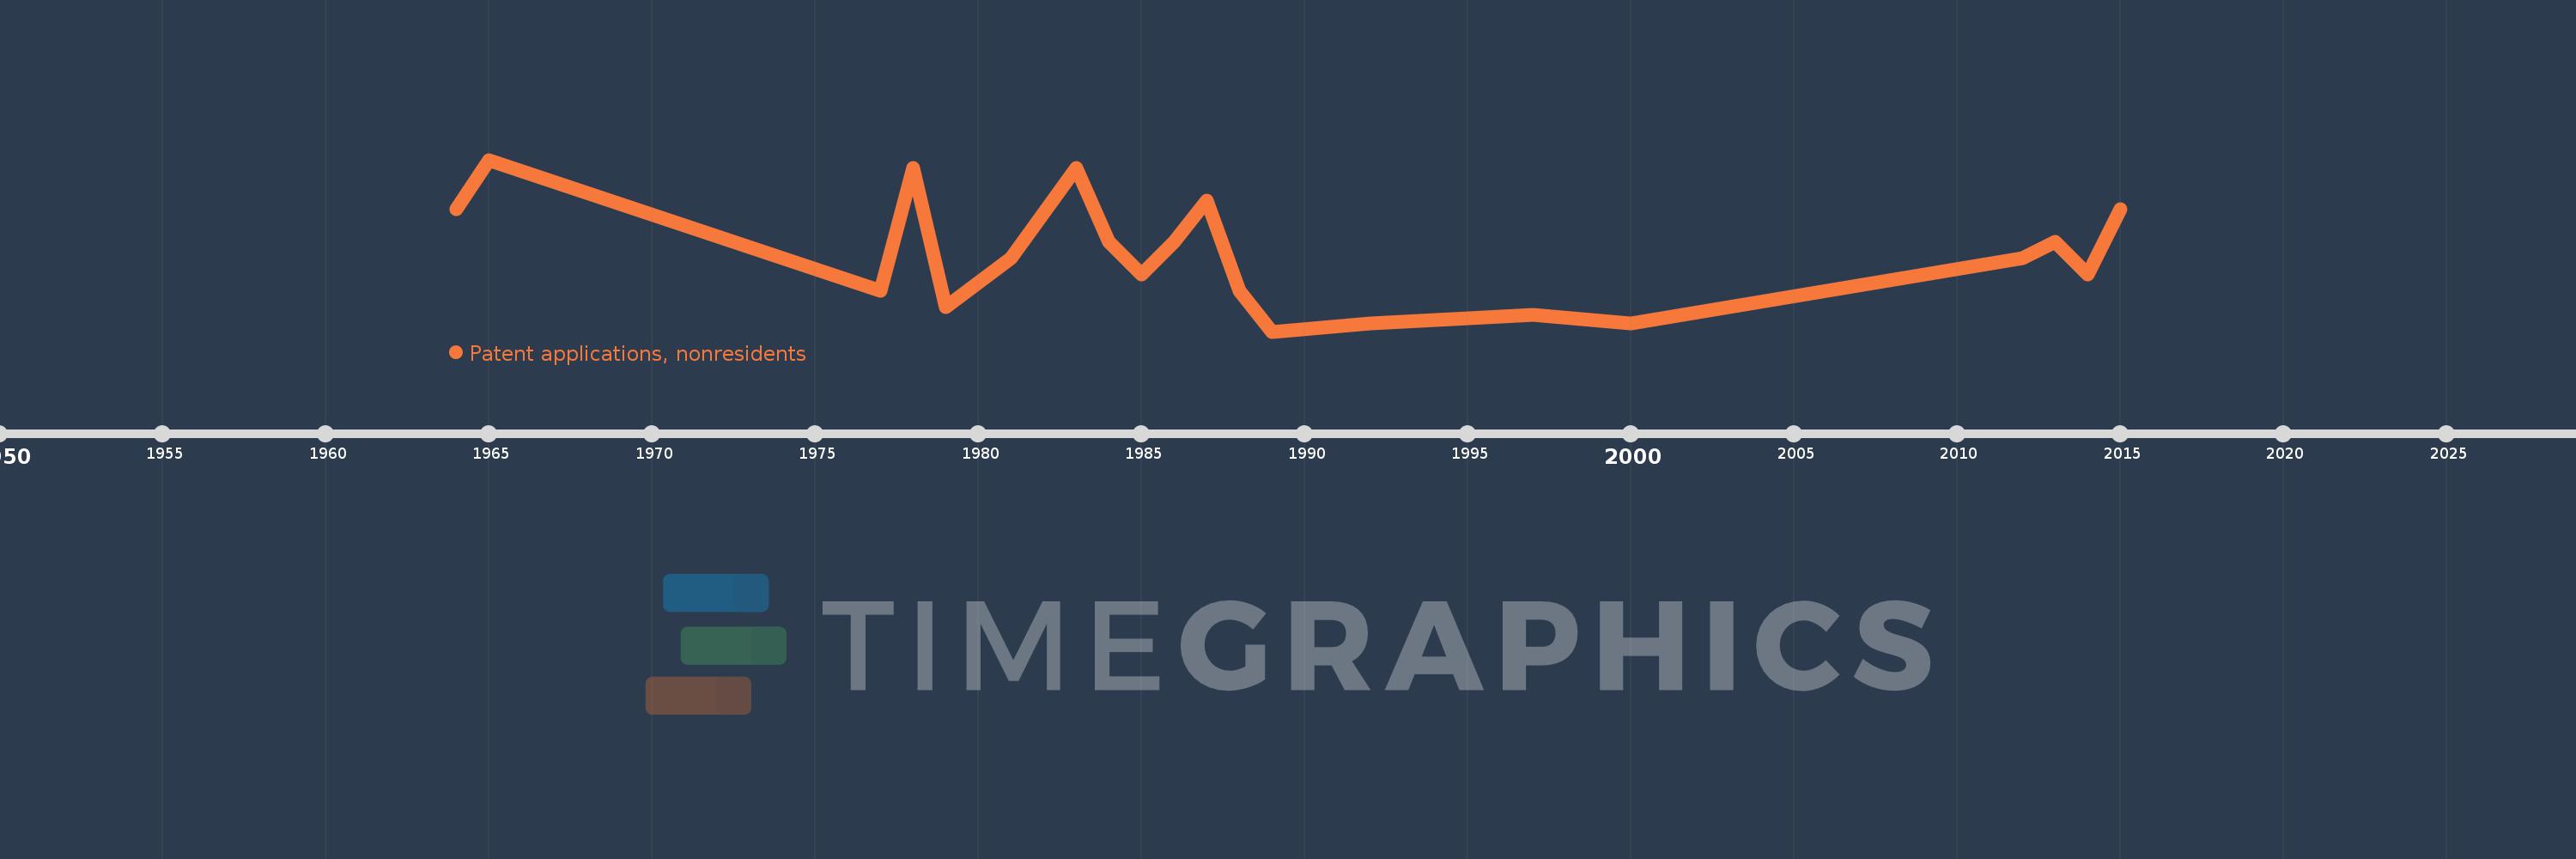
This timeline shows a graph from 1964 to 2015 of Haiti. No data until 1963. Number of actual observations by date: 20.
Source name:
World Development Indicators
Source organization:
World Intellectual Property Organization (WIPO), WIPO Patent Report: Statistics on Worldwide Patent Activity. The International Bureau of WIPO assumes no responsibility with respect to the transformation of these data.
Categories, topics:
Science & Technology
Last updated:
apr 23, 2017
Indicators value changes by year
Meaning:
13.45
Minimum:
4.0
jan 1, 1989
Maximum:
25.0
jan 1, 1965
At the date of observation
Value
Absolute change
Change from the previous value
jan 1, 1964
19.0
+19.0
0.0%
jan 1, 1965
25.0
+6.0
31.58%
jan 1, 1977
9.0
-16.0
-64.0%
jan 1, 1978
24.0
+15.0
166.67%
jan 1, 1979
7.0
-17.0
-70.83%
jan 1, 1981
13.0
+6.0
85.71%
jan 1, 1983
24.0
+11.0
84.62%
jan 1, 1984
15.0
-9.0
-37.5%
jan 1, 1985
11.0
-4.0
-26.67%
jan 1, 1986
15.0
+4.0
36.36%
jan 1, 1987
20.0
+5.0
33.33%
jan 1, 1988
9.0
-11.0
-55.0%
jan 1, 1989
4.0
-5.0
-55.56%
jan 1, 1992
5.0
+1.0
25.0%
jan 1, 1997
6.0
+1.0
20.0%
jan 1, 2000
5.0
-1.0
-16.67%
jan 1, 2012
13.0
+8.0
160.0%
jan 1, 2013
15.0
+2.0
15.38%
jan 1, 2014
11.0
-4.0
-26.67%
jan 1, 2015
19.0
+8.0
72.73%
Ranking of countries by current statistics by years