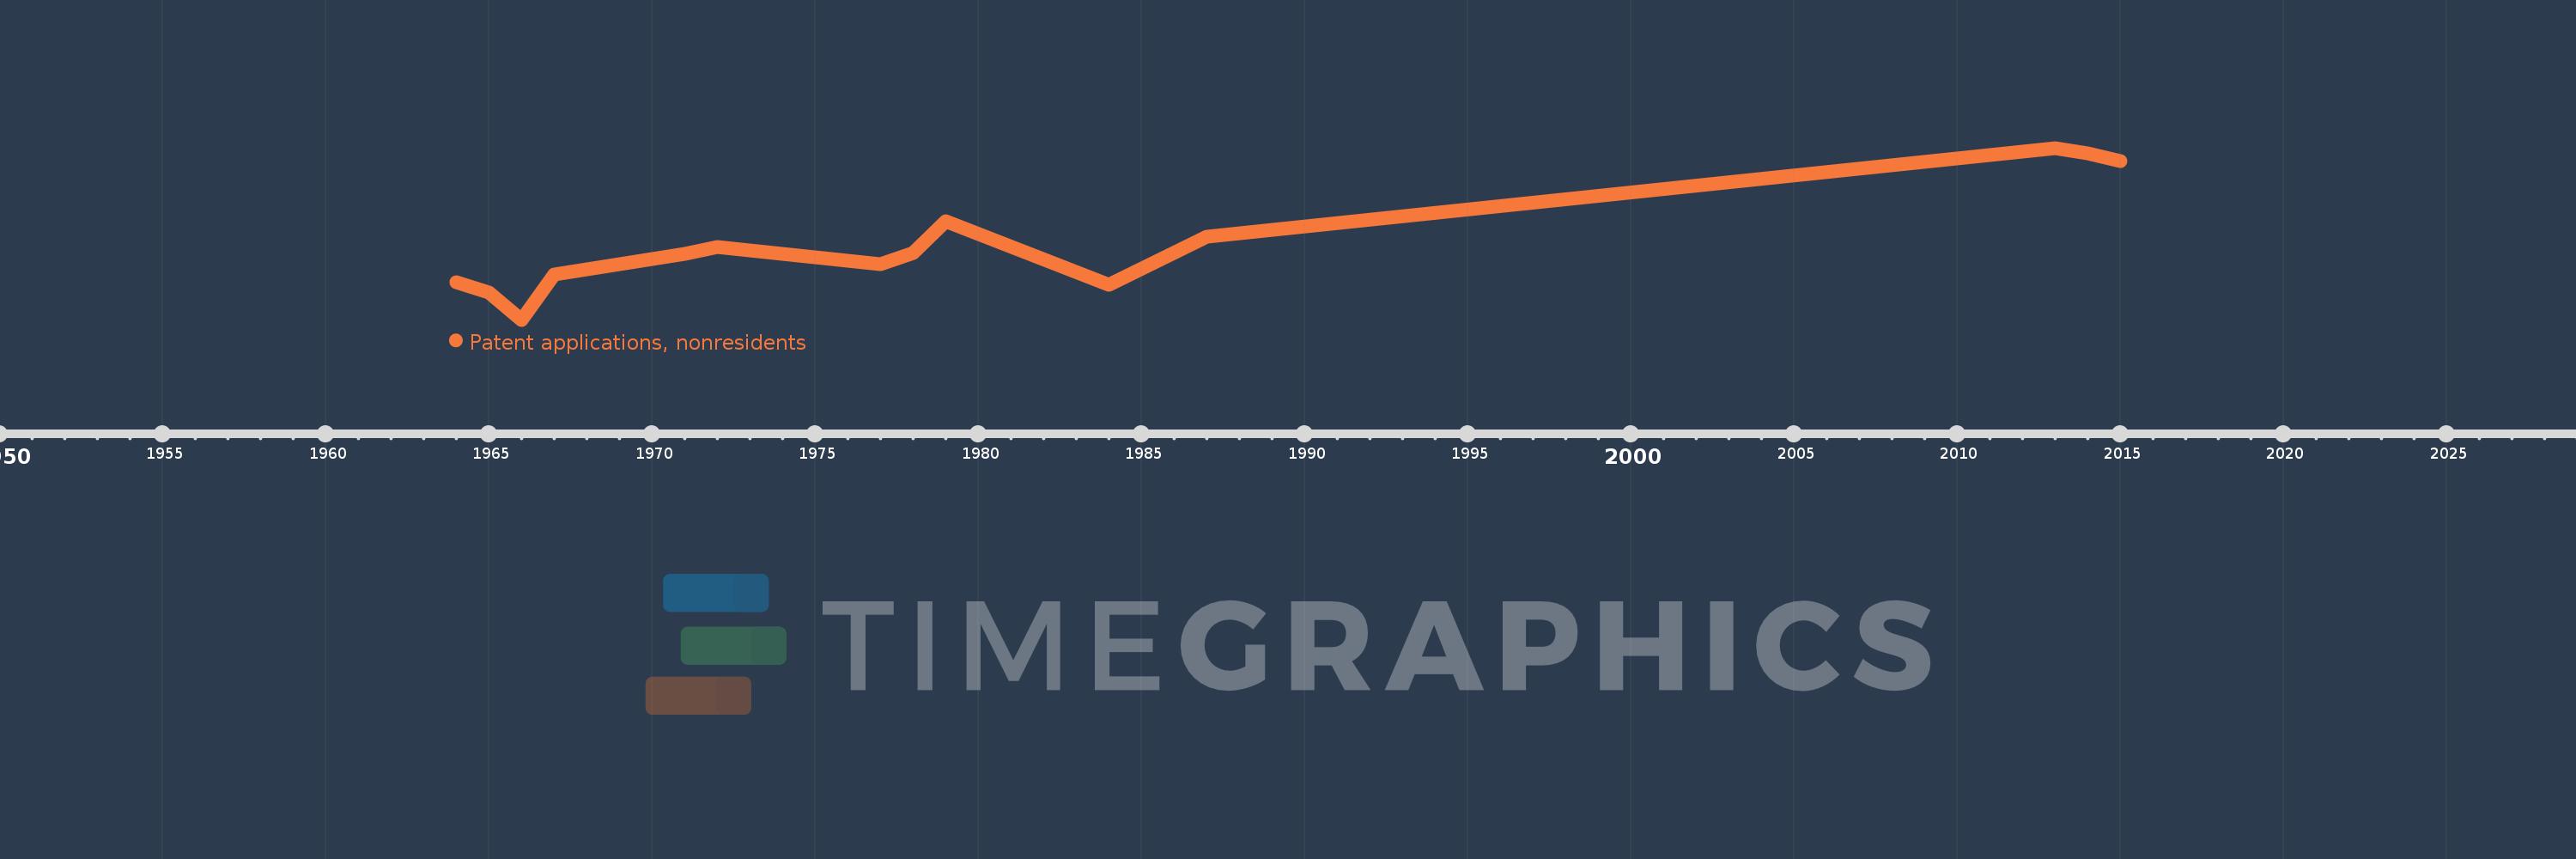
This timeline shows a graph from 1964 to 2015 of Dominican Republic. No data until 1963. Number of actual observations by date: 14.
Source name:
World Development Indicators
Source organization:
World Intellectual Property Organization (WIPO), WIPO Patent Report: Statistics on Worldwide Patent Activity. The International Bureau of WIPO assumes no responsibility with respect to the transformation of these data.
Categories, topics:
Science & Technology
Last updated:
apr 23, 2017
Indicators value changes by year
Meaning:
127.286
Minimum:
15.0
jan 1, 1966
Maximum:
264.0
jan 1, 2013
At the date of observation
Value
Absolute change
Change from the previous value
jan 1, 1964
70.0
+70.0
0.0%
jan 1, 1965
55.0
-15.0
-21.43%
jan 1, 1966
15.0
-40.0
-72.73%
jan 1, 1967
80.0
+65.0
433.33%
jan 1, 1971
110.0
+30.0
37.5%
jan 1, 1972
120.0
+10.0
9.09%
jan 1, 1977
96.0
-24.0
-20.0%
jan 1, 1978
112.0
+16.0
16.67%
jan 1, 1979
158.0
+46.0
41.07%
jan 1, 1984
66.0
-92.0
-58.23%
jan 1, 1987
135.0
+69.0
104.55%
jan 1, 2013
264.0
+129.0
95.56%
jan 1, 2014
256.0
-8.0
-3.03%
jan 1, 2015
245.0
-11.0
-4.3%
Ranking of countries by current statistics by years