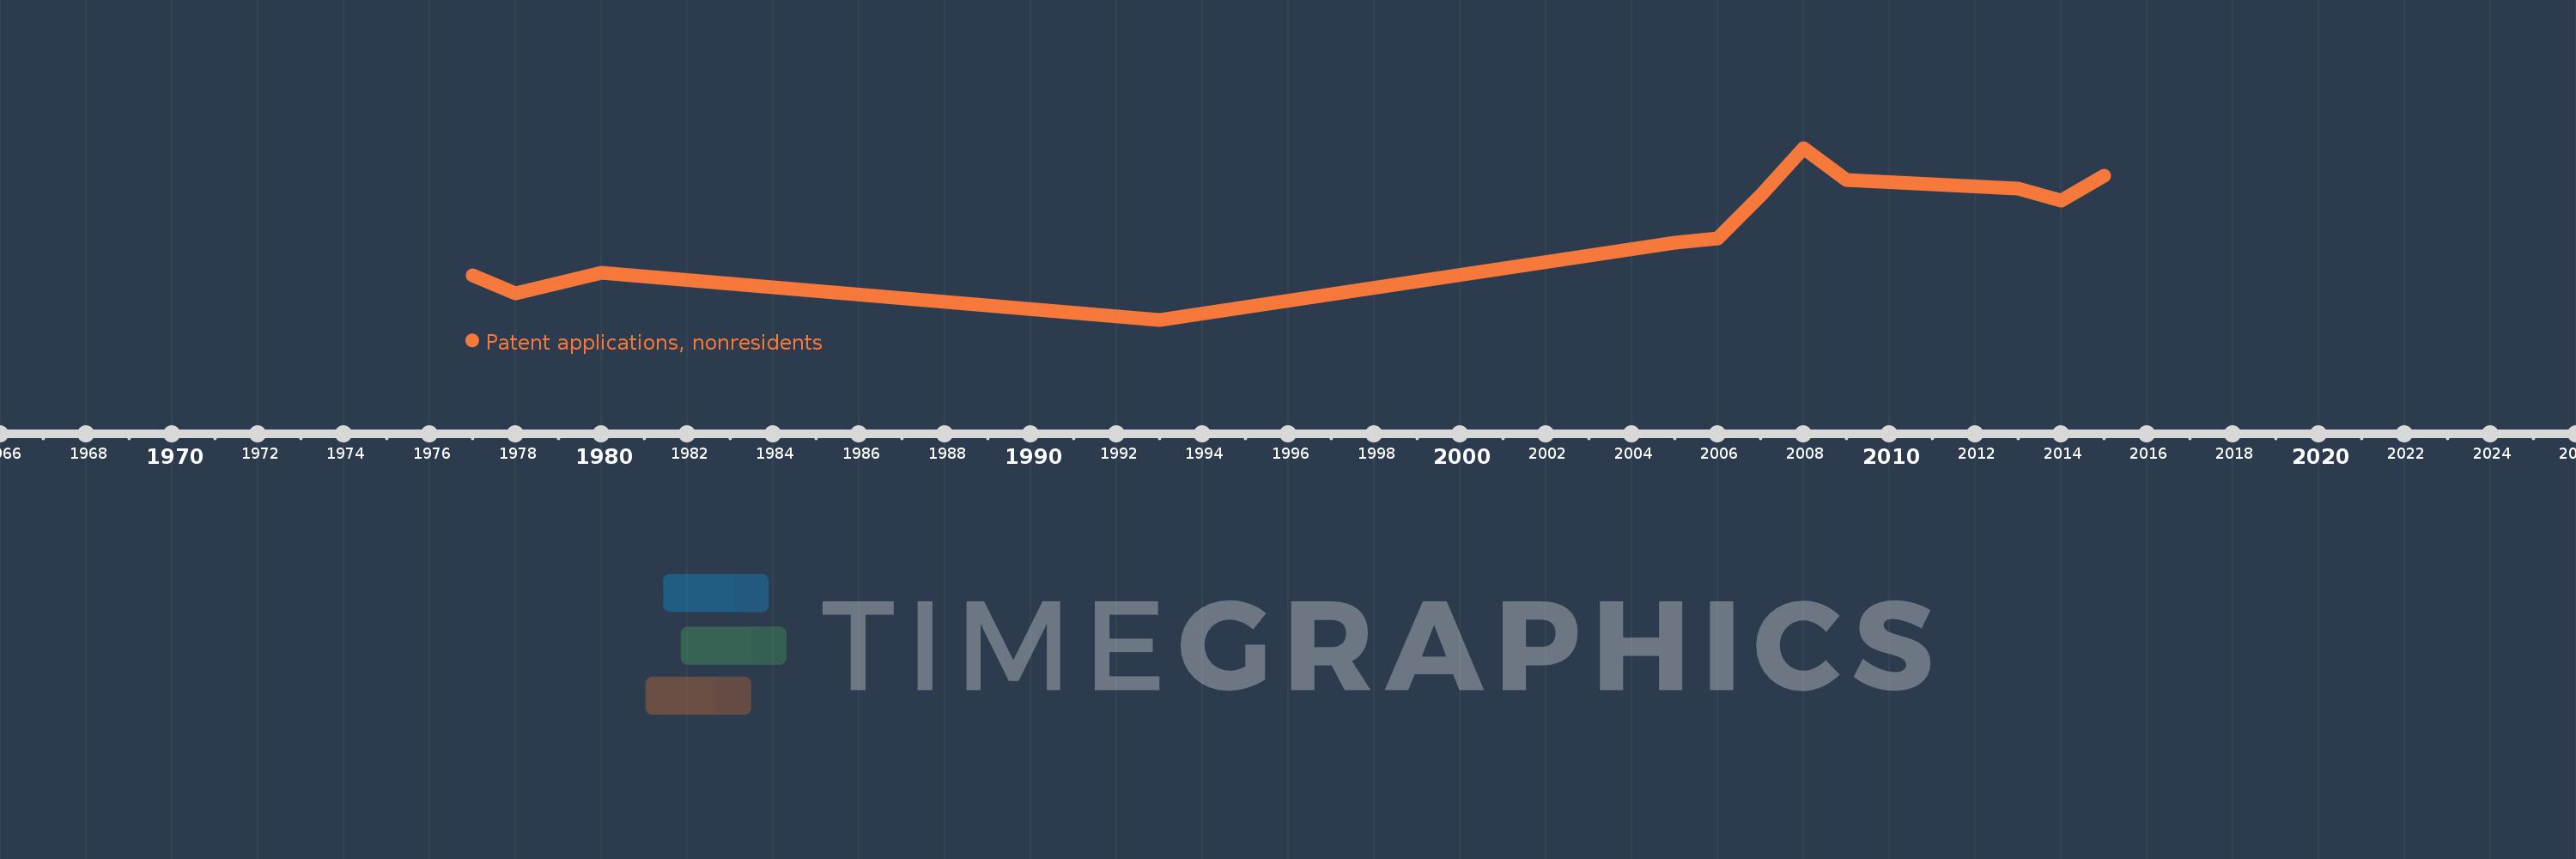
This timeline shows a graph from 1977 to 2015 of Caribbean small states. No data until 1976. Number of actual observations by date: 12.
Source name:
World Development Indicators
Source organization:
World Intellectual Property Organization (WIPO), WIPO Patent Report: Statistics on Worldwide Patent Activity. The International Bureau of WIPO assumes no responsibility with respect to the transformation of these data.
Categories, topics:
Science & Technology
Last updated:
apr 23, 2017
Indicators value changes by year
Meaning:
404.5
Minimum:
143.0
jan 1, 1993
Maximum:
631.0
jan 1, 2008
At the date of observation
Value
Absolute change
Change from the previous value
jan 1, 1977
269.0
+269.0
0.0%
jan 1, 1978
219.0
-50.0
-18.59%
jan 1, 1980
276.0
+57.0
26.03%
jan 1, 1993
143.0
-133.0
-48.19%
jan 1, 2005
362.0
+219.0
153.15%
jan 1, 2006
373.0
+11.0
3.04%
jan 1, 2007
495.0
+122.0
32.71%
jan 1, 2008
631.0
+136.0
27.47%
jan 1, 2009
539.0
-92.0
-14.58%
jan 1, 2013
515.0
-24.0
-4.45%
jan 1, 2014
481.0
-34.0
-6.6%
jan 1, 2015
551.0
+70.0
14.55%
Ranking of countries by current statistics by years