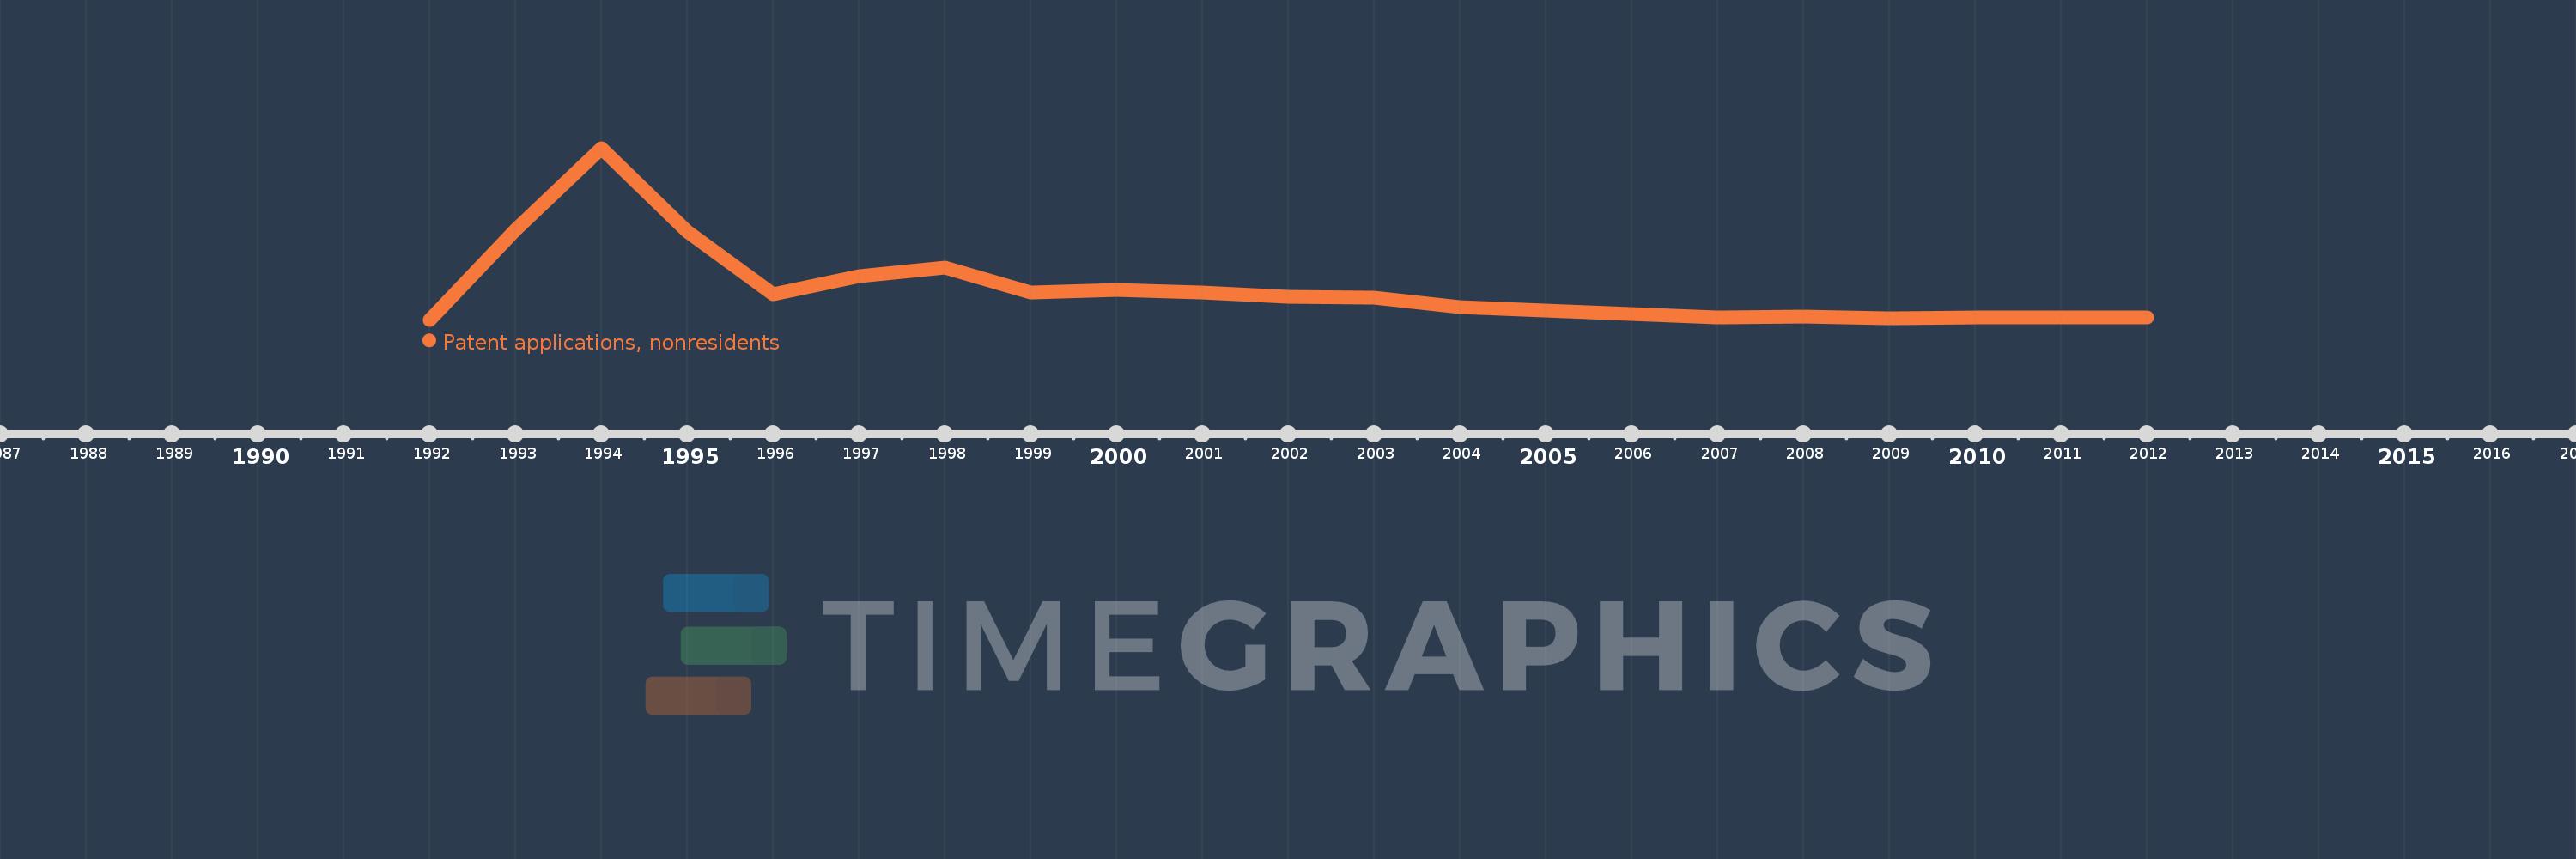
This timeline shows a graph from 1992 to 2012 of Slovenia. No data until 1991. Number of actual observations by date: 21.
Source name:
World Development Indicators
Source organization:
World Intellectual Property Organization (WIPO), WIPO Patent Report: Statistics on Worldwide Patent Activity. The International Bureau of WIPO assumes no responsibility with respect to the transformation of these data.
Categories, topics:
Science & Technology
Last updated:
apr 23, 2017
Indicators value changes by year
Meaning:
140.381
Minimum:
1.0
jan 1, 1992
Maximum:
784.0
jan 1, 1994
At the date of observation
Value
Absolute change
Change from the previous value
jan 1, 1992
1.0
+1.0
0.0%
jan 1, 1993
409.0
+408.0
40.8K%
jan 1, 1994
784.0
+375.0
91.69%
jan 1, 1995
404.0
-380.0
-48.47%
jan 1, 1996
116.0
-288.0
-71.29%
jan 1, 1997
201.0
+85.0
73.28%
jan 1, 1998
238.0
+37.0
18.41%
jan 1, 1999
127.0
-111.0
-46.64%
jan 1, 2000
138.0
+11.0
8.66%
jan 1, 2001
124.0
-14.0
-10.14%
jan 1, 2002
107.0
-17.0
-13.71%
jan 1, 2003
101.0
-6.0
-5.61%
jan 1, 2004
60.0
-41.0
-40.59%
jan 1, 2005
42.0
-18.0
-30.0%
jan 1, 2006
29.0
-13.0
-30.95%
jan 1, 2007
12.0
-17.0
-58.62%
jan 1, 2008
15.0
+3.0
25.0%
jan 1, 2009
6.0
-9.0
-60.0%
jan 1, 2010
12.0
+6.0
100.0%
jan 1, 2011
11.0
-1.0
-8.33%
jan 1, 2012
11.0
0.0
0.0%
Ranking of countries by current statistics by years