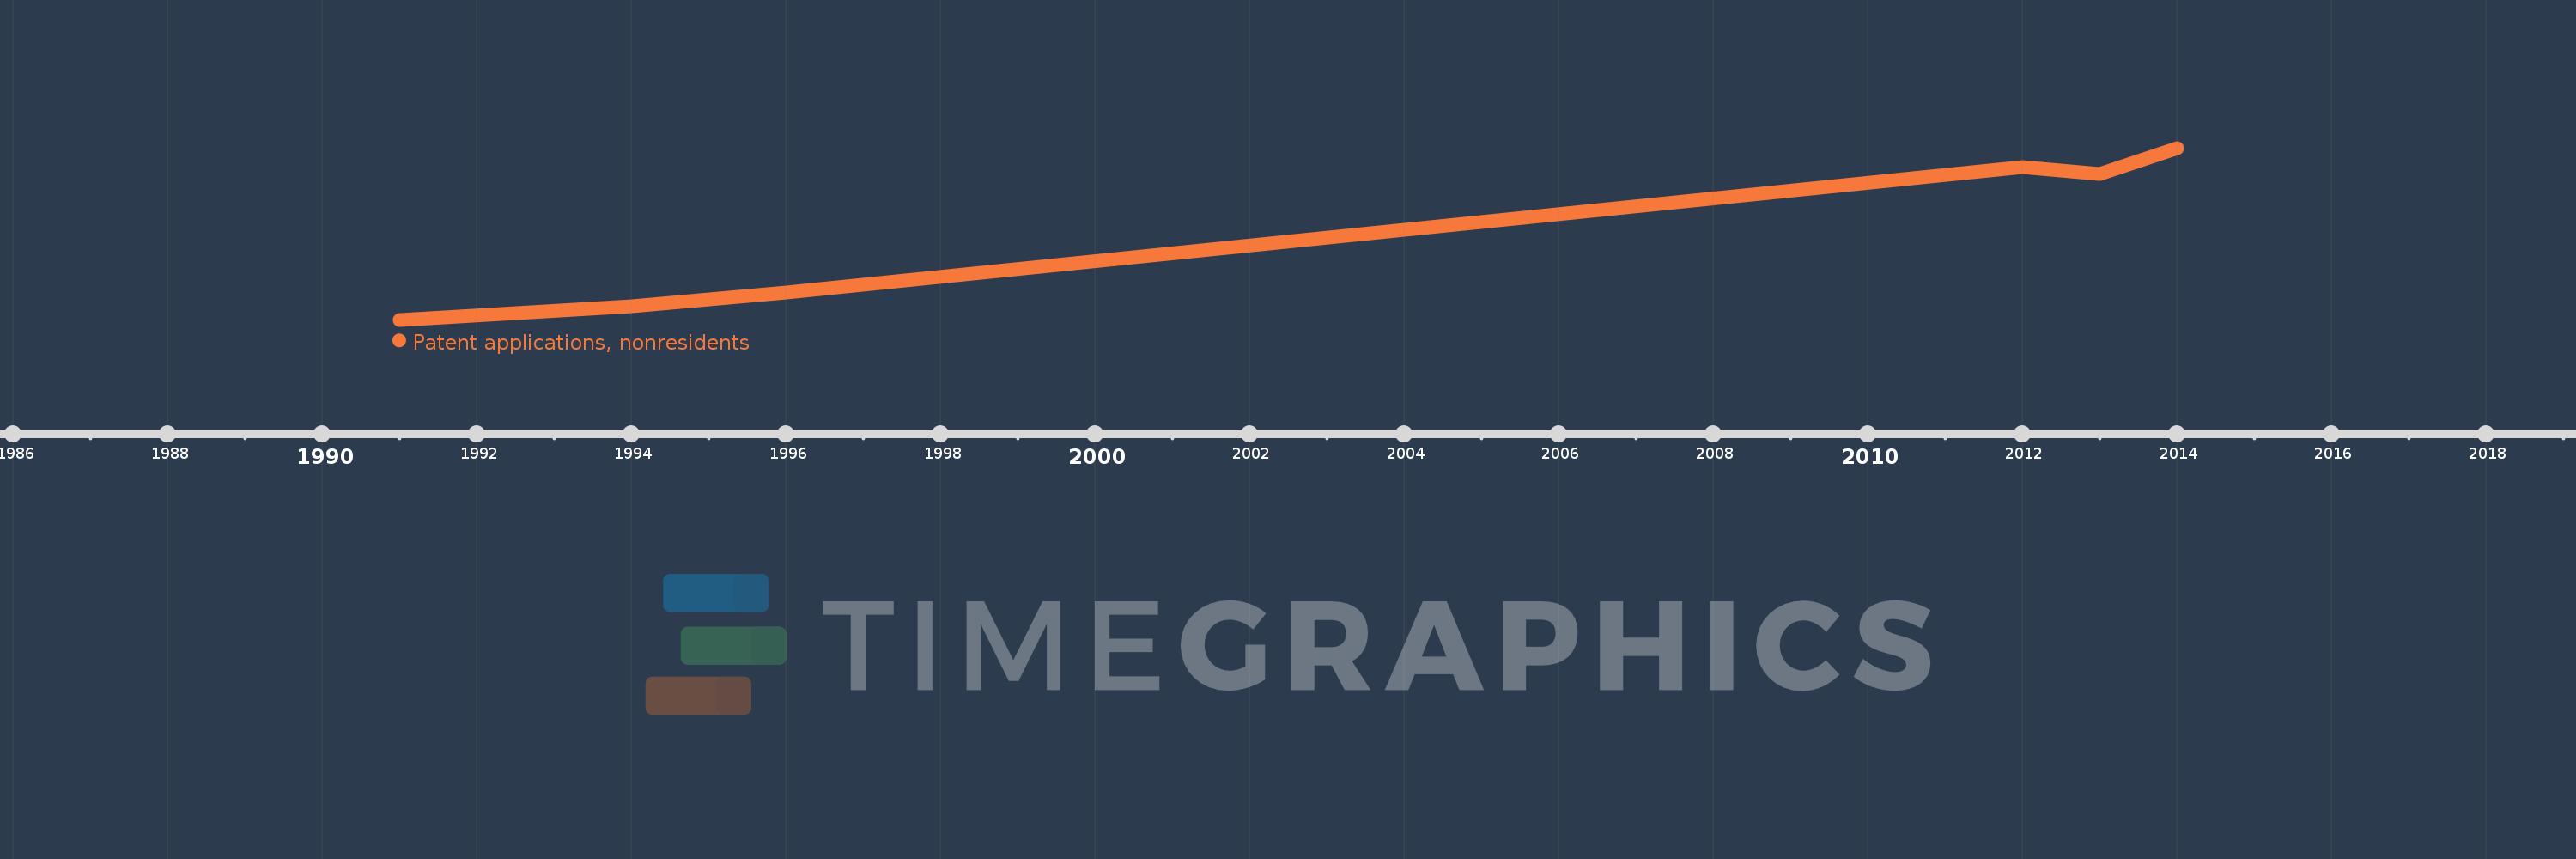
This timeline shows a graph from 1991 to 2014 of IDA blend. No data until 1990. Number of actual observations by date: 6.
Source name:
World Development Indicators
Source organization:
World Intellectual Property Organization (WIPO), WIPO Patent Report: Statistics on Worldwide Patent Activity. The International Bureau of WIPO assumes no responsibility with respect to the transformation of these data.
Categories, topics:
Science & Technology
Last updated:
apr 23, 2017
Indicators value changes by year
Meaning:
3.464K
Minimum:
1.031K
jan 1, 1991
Maximum:
5.931K
jan 1, 2014
At the date of observation
Value
Absolute change
Change from the previous value
jan 1, 1991
1.031K
+1.031K
0.0%
jan 1, 1994
1.422K
+391.0
37.92%
jan 1, 1996
1.812K
+390.0
27.43%
jan 1, 2012
5.388K
+3.576K
197.35%
jan 1, 2013
5.2K
-188.0
-3.49%
jan 1, 2014
5.931K
+731.0
14.06%
Ranking of countries by current statistics by years