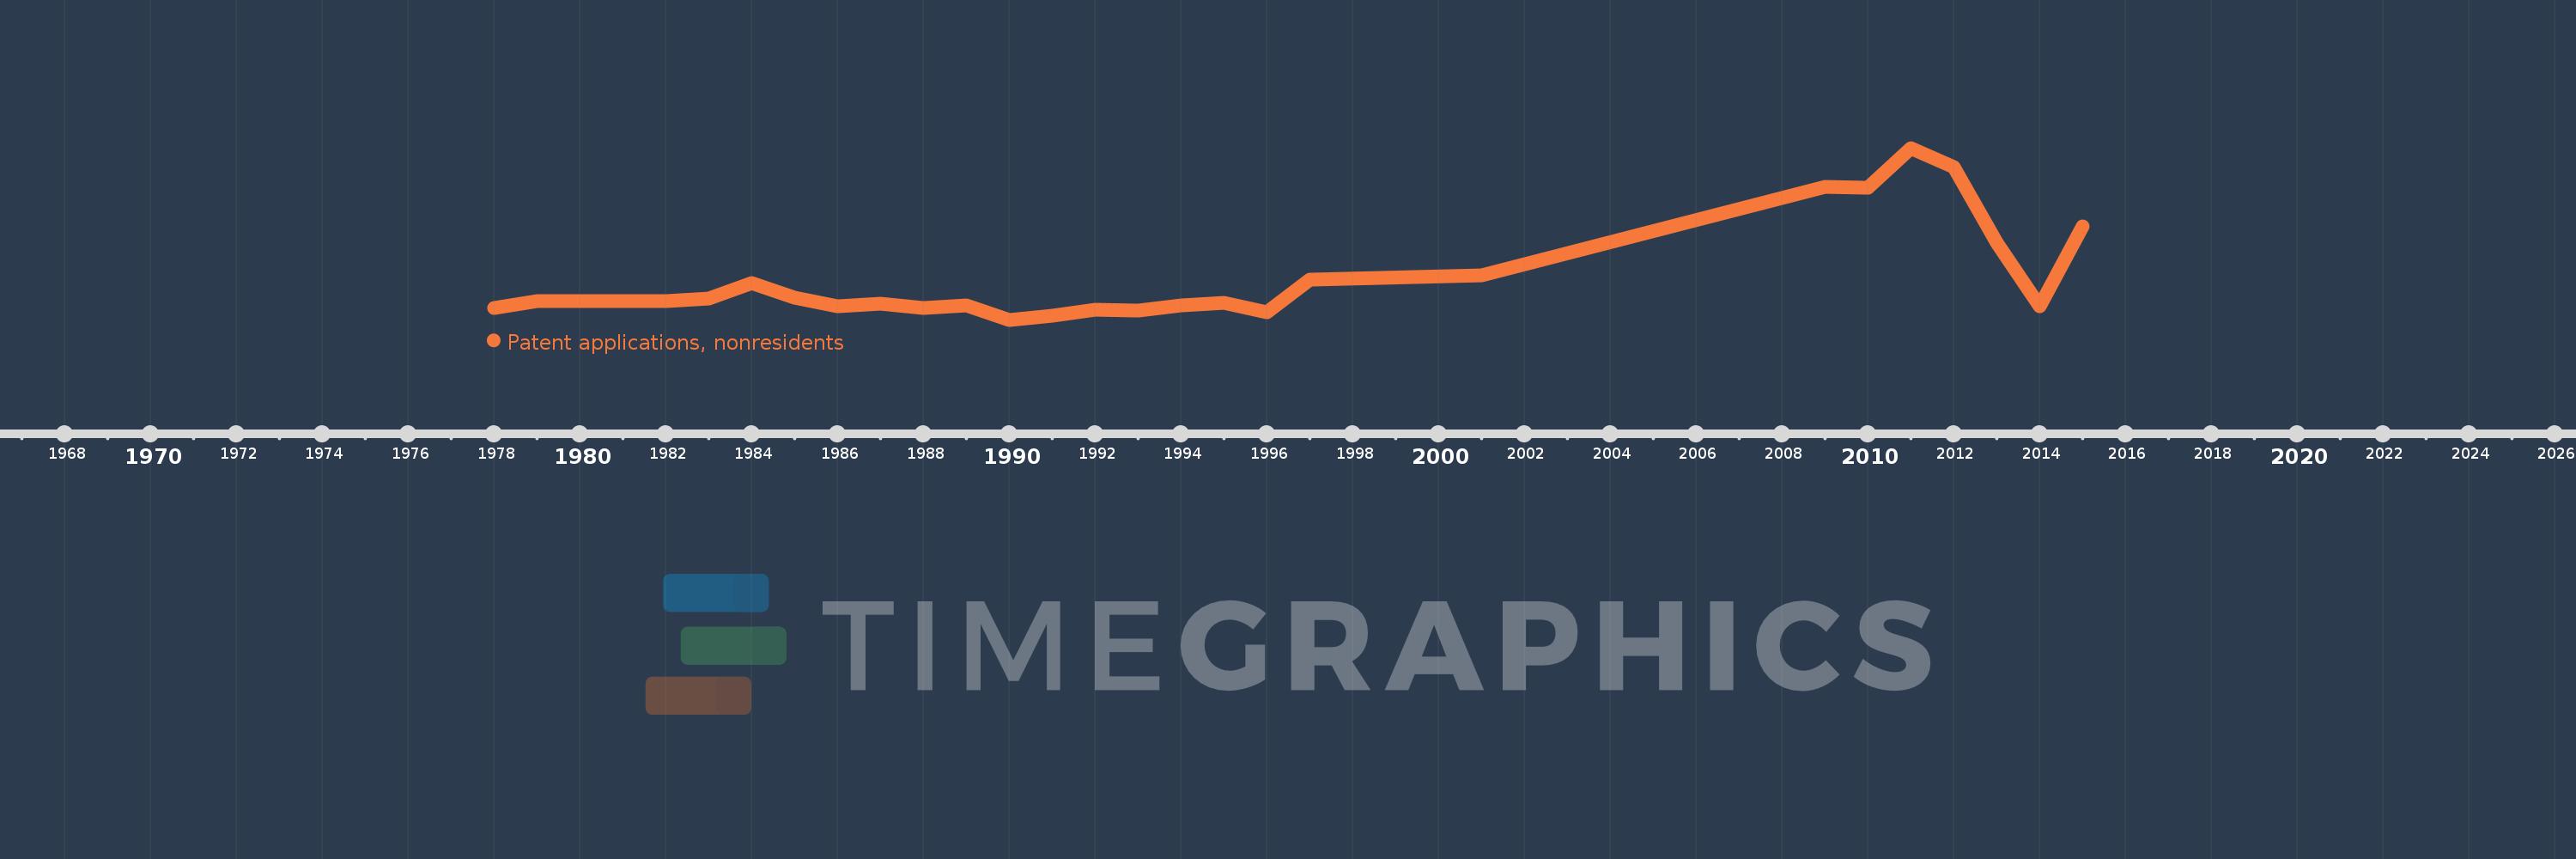
This timeline shows a graph from 1978 to 2015 of Panama. No data until 1977. Number of actual observations by date: 27.
Source name:
World Development Indicators
Source organization:
World Intellectual Property Organization (WIPO), WIPO Patent Report: Statistics on Worldwide Patent Activity. The International Bureau of WIPO assumes no responsibility with respect to the transformation of these data.
Categories, topics:
Science & Technology
Last updated:
apr 23, 2017
Indicators value changes by year
Meaning:
146.444
Minimum:
44.0
jan 1, 1990
Maximum:
468.0
jan 1, 2011
At the date of observation
Value
Absolute change
Change from the previous value
jan 1, 1978
74.0
+74.0
0.0%
jan 1, 1979
89.0
+15.0
20.27%
jan 1, 1981
90.0
+1.0
1.12%
jan 1, 1982
90.0
0.0
0.0%
jan 1, 1983
97.0
+7.0
7.78%
jan 1, 1984
134.0
+37.0
38.14%
jan 1, 1985
98.0
-36.0
-26.87%
jan 1, 1986
78.0
-20.0
-20.41%
jan 1, 1987
83.0
+5.0
6.41%
jan 1, 1988
73.0
-10.0
-12.05%
jan 1, 1989
79.0
+6.0
8.22%
jan 1, 1990
44.0
-35.0
-44.3%
jan 1, 1991
53.0
+9.0
20.45%
jan 1, 1992
68.0
+15.0
28.3%
jan 1, 1993
66.0
-2.0
-2.94%
jan 1, 1994
80.0
+14.0
21.21%
jan 1, 1995
86.0
+6.0
7.5%
jan 1, 1996
62.0
-24.0
-27.91%
jan 1, 1997
142.0
+80.0
129.03%
jan 1, 2001
153.0
+11.0
7.75%
jan 1, 2009
371.0
+218.0
142.48%
jan 1, 2010
370.0
-1.0
-0.27%
jan 1, 2011
468.0
+98.0
26.49%
jan 1, 2012
420.0
-48.0
-10.26%
jan 1, 2013
234.0
-186.0
-44.29%
jan 1, 2014
78.0
-156.0
-66.67%
jan 1, 2015
274.0
+196.0
251.28%
Ranking of countries by current statistics by years