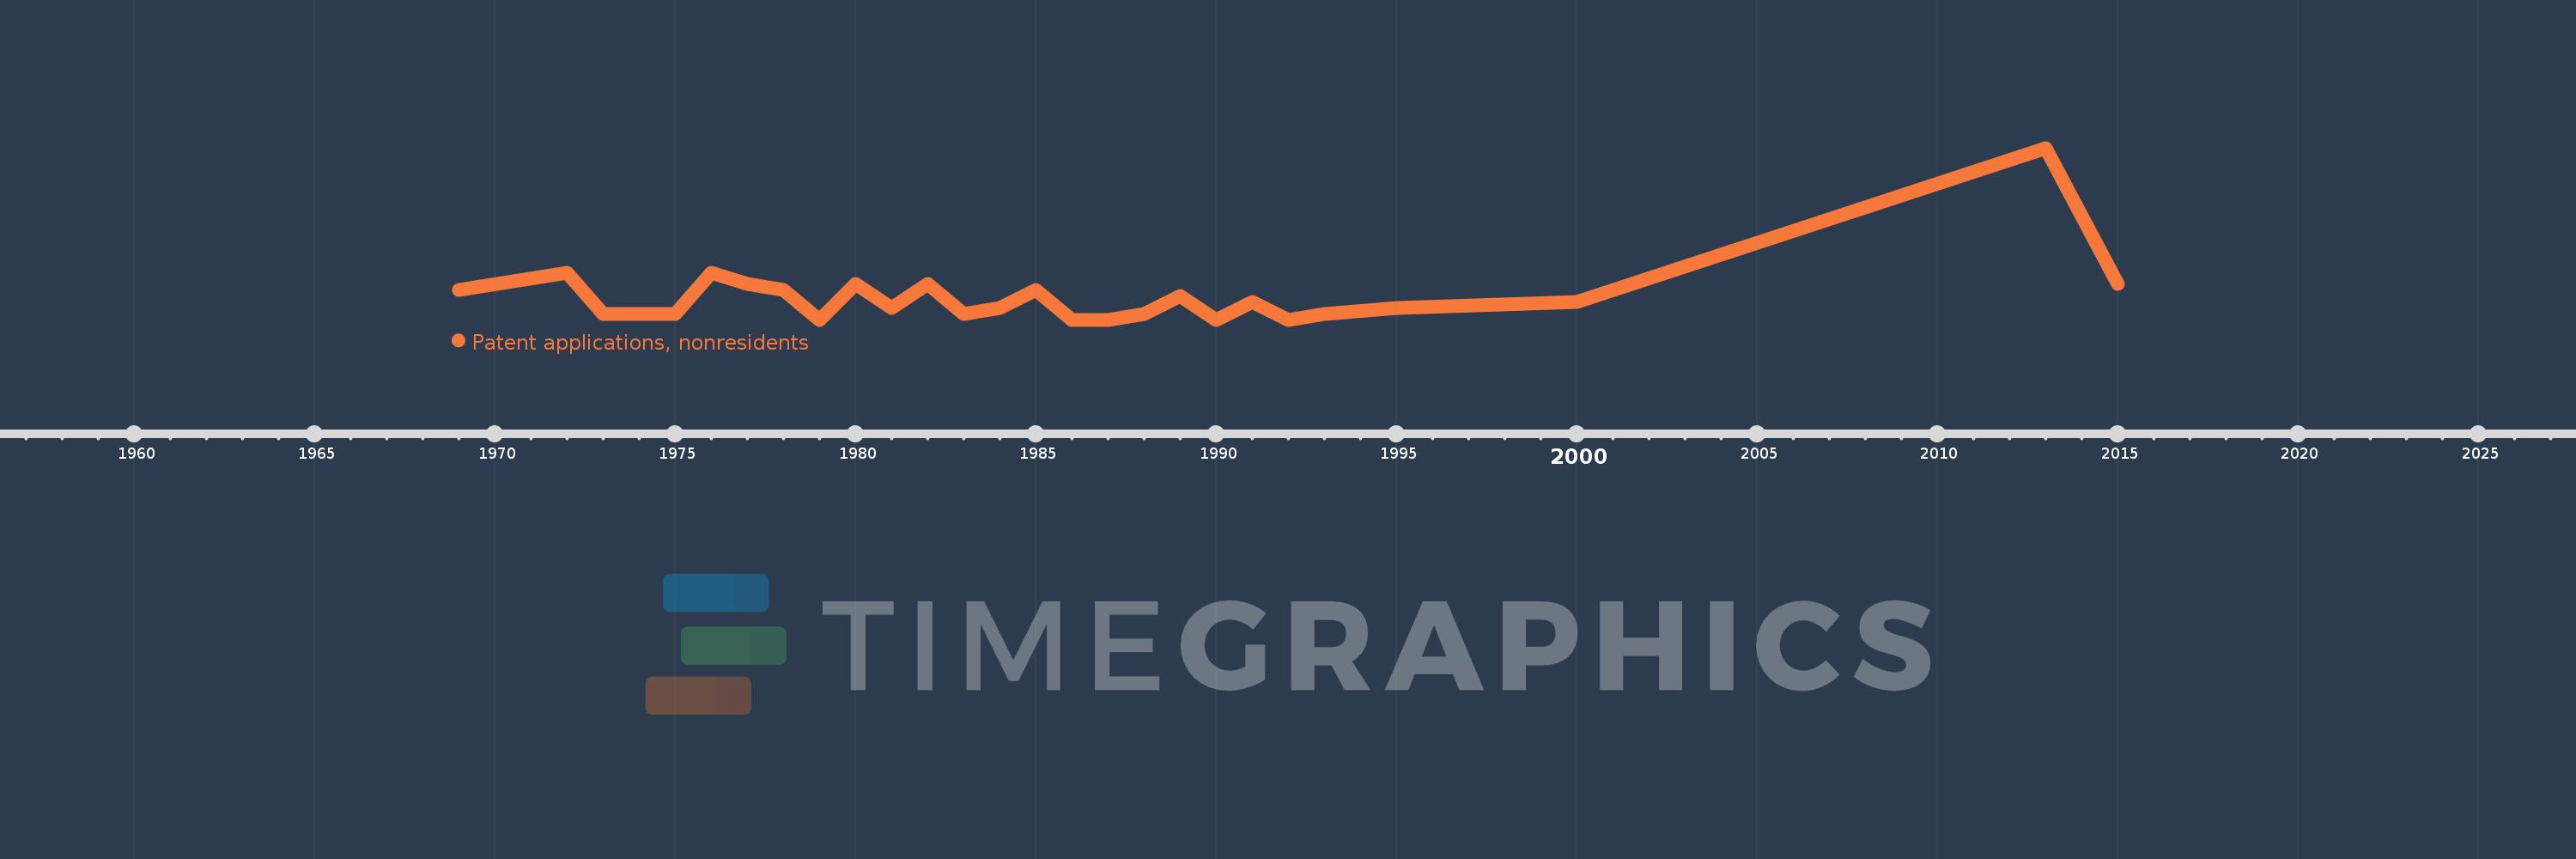
This timeline shows a graph from 1969 to 2015 of Rwanda. No data until 1968. Number of actual observations by date: 27.
Source name:
World Development Indicators
Source organization:
World Intellectual Property Organization (WIPO), WIPO Patent Report: Statistics on Worldwide Patent Activity. The International Bureau of WIPO assumes no responsibility with respect to the transformation of these data.
Categories, topics:
Science & Technology
Last updated:
apr 23, 2017
Indicators value changes by year
Meaning:
4.926
Minimum:
1.0
jan 1, 1979
Maximum:
30.0
jan 1, 2013
At the date of observation
Value
Absolute change
Change from the previous value
jan 1, 1969
6.0
+6.0
0.0%
jan 1, 1972
9.0
+3.0
50.0%
jan 1, 1973
2.0
-7.0
-77.78%
jan 1, 1974
2.0
0.0
0.0%
jan 1, 1975
2.0
0.0
0.0%
jan 1, 1976
9.0
+7.0
350.0%
jan 1, 1977
7.0
-2.0
-22.22%
jan 1, 1978
6.0
-1.0
-14.29%
jan 1, 1979
1.0
-5.0
-83.33%
jan 1, 1980
7.0
+6.0
600.0%
jan 1, 1981
3.0
-4.0
-57.14%
jan 1, 1982
7.0
+4.0
133.33%
jan 1, 1983
2.0
-5.0
-71.43%
jan 1, 1984
3.0
+1.0
50.0%
jan 1, 1985
6.0
+3.0
100.0%
jan 1, 1986
1.0
-5.0
-83.33%
jan 1, 1987
1.0
0.0
0.0%
jan 1, 1988
2.0
+1.0
100.0%
jan 1, 1989
5.0
+3.0
150.0%
jan 1, 1990
1.0
-4.0
-80.0%
jan 1, 1991
4.0
+3.0
300.0%
jan 1, 1992
1.0
-3.0
-75.0%
jan 1, 1993
2.0
+1.0
100.0%
jan 1, 1995
3.0
+1.0
50.0%
jan 1, 2000
4.0
+1.0
33.33%
jan 1, 2013
30.0
+26.0
650.0%
jan 1, 2015
7.0
-23.0
-76.67%
Ranking of countries by current statistics by years