33
/
AIzaSyAYiBZKx7MnpbEhh9jyipgxe19OcubqV5w
August 1, 2025
279123
Uzbekistan
UZB
true
2
1
Patent applications, nonresidents
2015,2014,2013,2012,2011,2010,2009,2008,2007,2006,2005,2004,2003,2002,2001,2000,1998,1997,1996,1995,1994
Download
Global statistics library →Uzbekistan →

Patent applications, nonresidents

This statistics in other country:

AlbaniaAlgeriaAngolaAntigua and BarbudaArab WorldArgentinaArmeniaAustraliaAustriaAzerbaijanBahamas, TheBahrainBangladeshBarbadosBelarusBelgiumBelizeBhutanBoliviaBosnia and HerzegovinaBotswanaBrazilBrunei DarussalamBulgariaBurundiCambodiaCanadaCaribbean small statesCentral Europe and the BalticsChileChinaColombiaCongo, Dem. Rep.Congo, Rep.Costa RicaCote d'IvoireCroatiaCubaCyprusCzech RepublicDenmarkDjiboutiDominicaDominican RepublicEarly-demographic dividendEast Asia & PacificEast Asia & Pacific (excluding high income)East Asia & Pacific (IDA & IBRD countries)EcuadorEgypt, Arab Rep.El SalvadorEstoniaEthiopiaEuro areaEurope & Central AsiaEurope & Central Asia (excluding high income)Europe & Central Asia (IDA & IBRD countries)European UnionFijiFinlandFranceGambia, TheGeorgiaGermanyGhanaGreeceGrenadaGuatemalaGuyanaHaitiHigh incomeHondurasHong Kong SAR, ChinaHungaryIBRD onlyIcelandIDA & IBRD totalIDA blendIndiaIndonesiaIran, Islamic Rep.IraqIrelandIsraelItalyJamaicaJapanJordanKazakhstanKenyaKiribatiKorea, Dem. People’s Rep.Korea, Rep.KuwaitKyrgyz RepublicLao PDRLate-demographic dividendLatin America & Caribbean Latin America & Caribbean (excluding high income)Latin America & the Caribbean (IDA & IBRD countries)LatviaLebanonLesothoLiberiaLibyaLithuaniaLow & middle incomeLower middle incomeLuxembourgMacao SAR, ChinaMacedonia, FYRMadagascarMalawiMalaysiaMaliMaltaMauritiusMexicoMiddle East & North AfricaMiddle East & North Africa (excluding high income)Middle East & North Africa (IDA & IBRD countries)Middle incomeMoldovaMonacoMongoliaMontenegroMoroccoMozambiqueNamibiaNepalNetherlandsNew ZealandNicaraguaNigeriaNorth AmericaNorwayOECD membersPacific island small statesPakistanPanamaPapua New GuineaParaguayPeruPhilippinesPolandPortugalPost-demographic dividendQatarRomaniaRussian FederationRwandaSamoaSao Tome and PrincipeSaudi ArabiaSerbiaSeychellesSierra LeoneSingaporeSlovak RepublicSloveniaSolomon IslandsSomaliaSouth AfricaSouth AsiaSouth Asia (IDA & IBRD)SpainSri LankaSt. LuciaSt. Vincent and the GrenadinesSudanSwazilandSwedenSwitzerlandSyrian Arab RepublicTajikistanTanzaniaThailandTrinidad and TobagoTunisiaTurkeyTurkmenistanUgandaUkraineUnited Arab EmiratesUnited KingdomUnited StatesUpper middle incomeUruguayUzbekistanVenezuela, RBVietnamWorldYemen, Rep.ZambiaZimbabwe

Timeline:

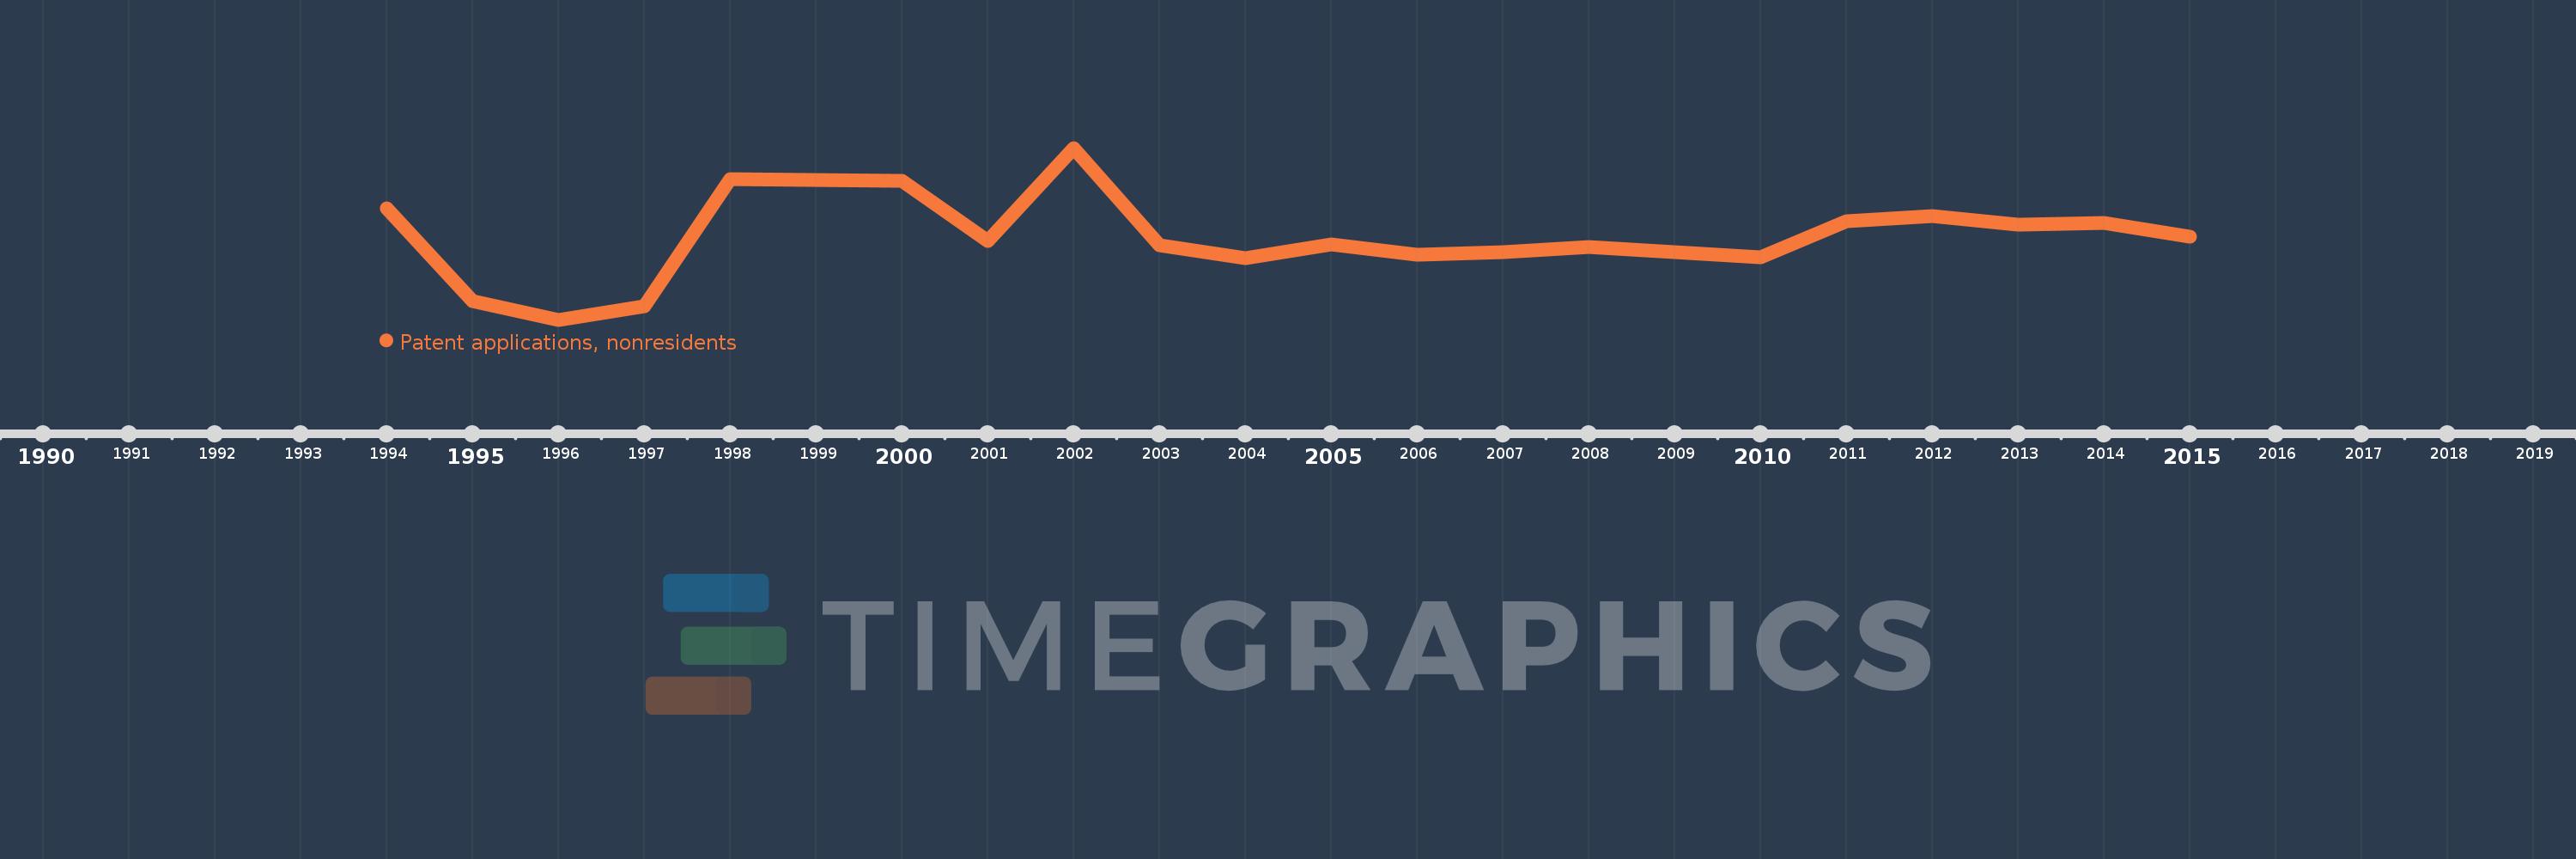
This timeline shows a graph from 1994 to 2015 of Uzbekistan. No data until 1993. Number of actual observations by date: 21.

Source name:

World Development Indicators

Source organization:

World Intellectual Property Organization (WIPO), WIPO Patent Report: Statistics on Worldwide Patent Activity. The International Bureau of WIPO assumes no responsibility with respect to the transformation of these data.

Categories, topics:

Science & Technology

Last updated:

apr 23, 2017

Indicators value changes by year

Meaning:
218.476
Minimum:
19.0
jan 1, 1996
Maximum:
443.0
jan 1, 2002
At the date of observation
Value
Absolute change
Change from the previous value
jan 1, 1994
295.0
+295.0
0.0%
jan 1, 1995
64.0
-231.0
-78.31%
jan 1, 1996
19.0
-45.0
-70.31%
jan 1, 1997
53.0
+34.0
178.95%
jan 1, 1998
367.0
+314.0
592.45%
jan 1, 2000
361.0
-6.0
-1.63%
jan 1, 2001
213.0
-148.0
-41.0%
jan 1, 2002
443.0
+230.0
107.98%
jan 1, 2003
203.0
-240.0
-54.18%
jan 1, 2004
171.0
-32.0
-15.76%
jan 1, 2005
205.0
+34.0
19.88%
jan 1, 2006
180.0
-25.0
-12.2%
jan 1, 2007
186.0
+6.0
3.33%
jan 1, 2008
198.0
+12.0
6.45%
jan 1, 2009
186.0
-12.0
-6.06%
jan 1, 2010
174.0
-12.0
-6.45%
jan 1, 2011
262.0
+88.0
50.57%
jan 1, 2012
274.0
+12.0
4.58%
jan 1, 2013
253.0
-21.0
-7.66%
jan 1, 2014
258.0
+5.0
1.98%
jan 1, 2015
223.0
-35.0
-13.57%

Ranking of countries by current statistics by years