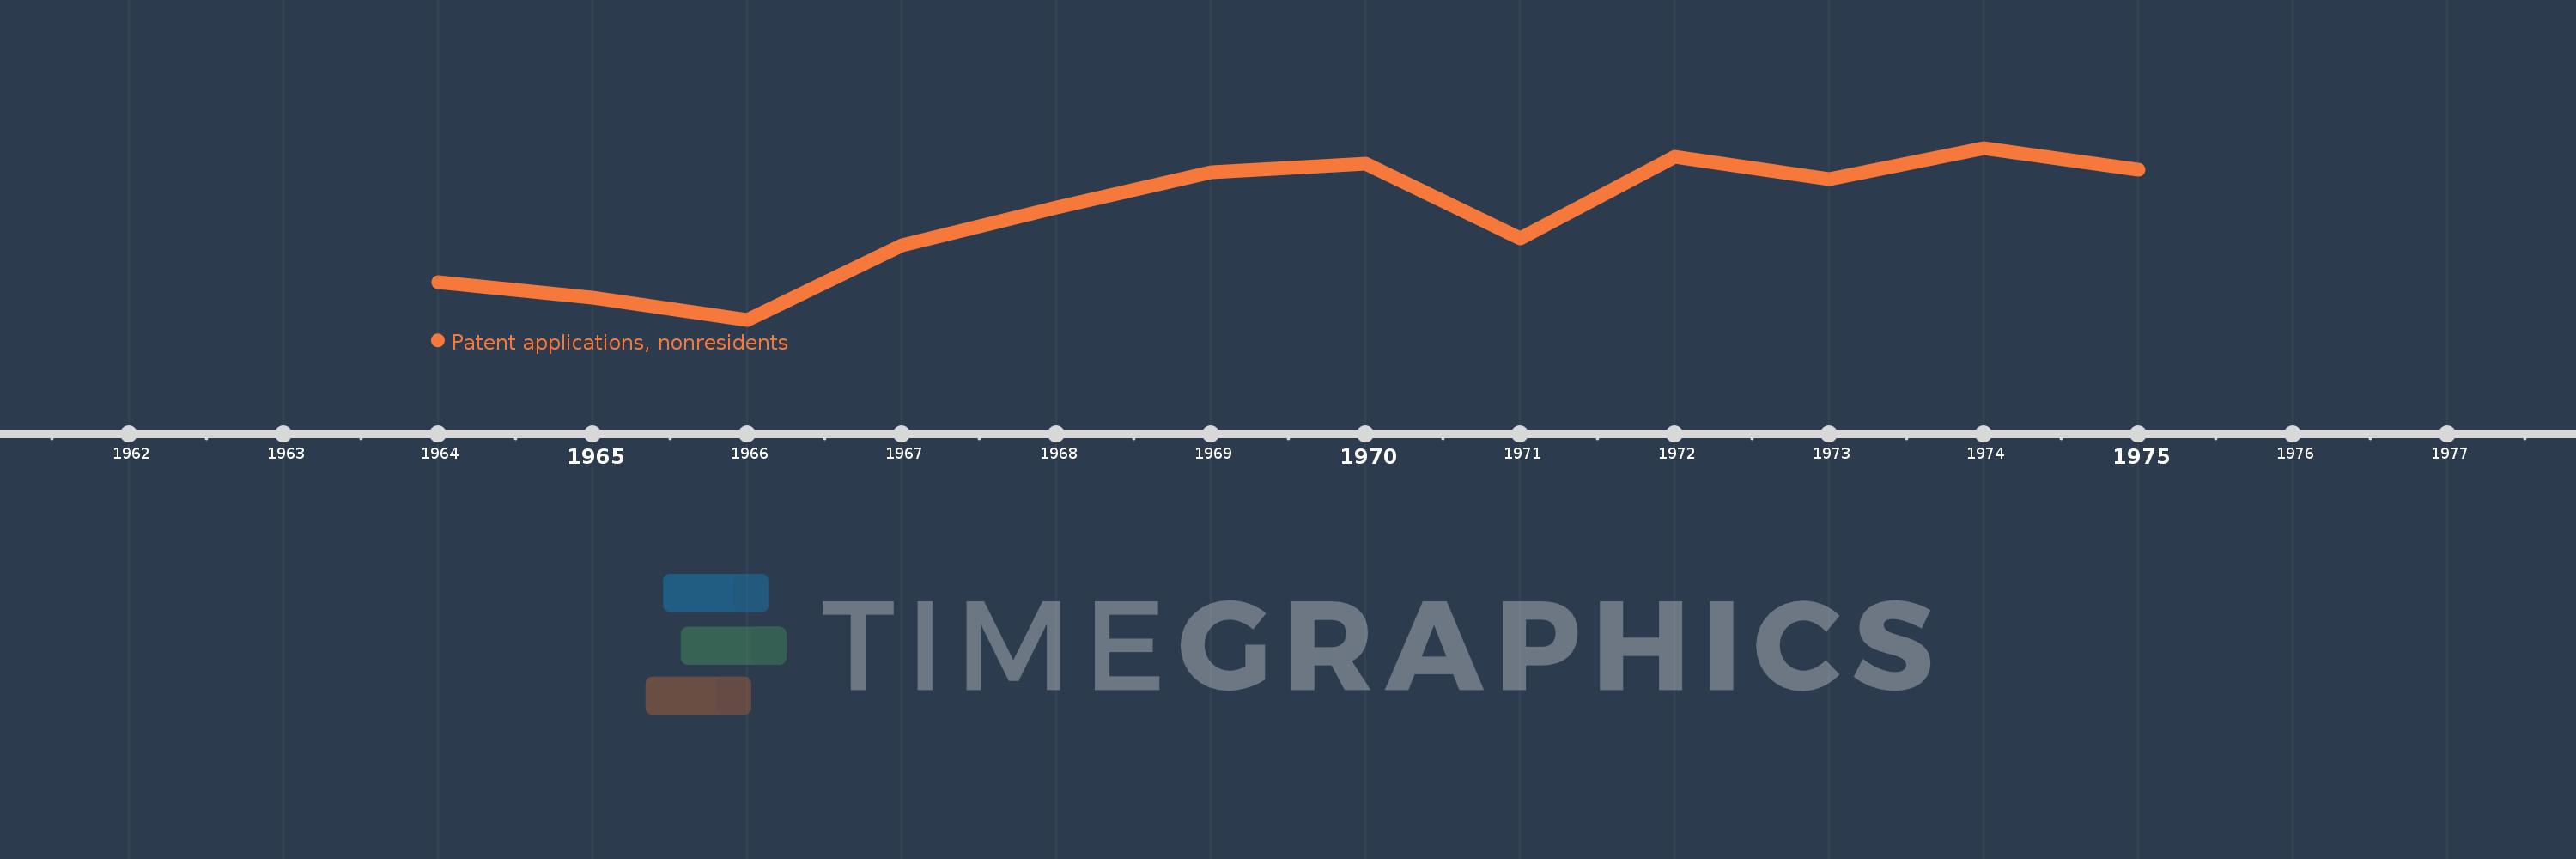
This timeline shows a graph from 1964 to 1975 of Lebanon. No data until 1963. Number of actual observations by date: 12.
Source name:
World Development Indicators
Source organization:
World Intellectual Property Organization (WIPO), WIPO Patent Report: Statistics on Worldwide Patent Activity. The International Bureau of WIPO assumes no responsibility with respect to the transformation of these data.
Categories, topics:
Science & Technology
Last updated:
apr 23, 2017
Indicators value changes by year
Meaning:
165.583
Minimum:
118.0
jan 1, 1966
Maximum:
196.0
jan 1, 1974
At the date of observation
Value
Absolute change
Change from the previous value
jan 1, 1964
135.0
+135.0
0.0%
jan 1, 1965
128.0
-7.0
-5.19%
jan 1, 1966
118.0
-10.0
-7.81%
jan 1, 1967
152.0
+34.0
28.81%
jan 1, 1968
169.0
+17.0
11.18%
jan 1, 1969
185.0
+16.0
9.47%
jan 1, 1970
189.0
+4.0
2.16%
jan 1, 1971
155.0
-34.0
-17.99%
jan 1, 1972
192.0
+37.0
23.87%
jan 1, 1973
182.0
-10.0
-5.21%
jan 1, 1974
196.0
+14.0
7.69%
jan 1, 1975
186.0
-10.0
-5.1%
Ranking of countries by current statistics by years