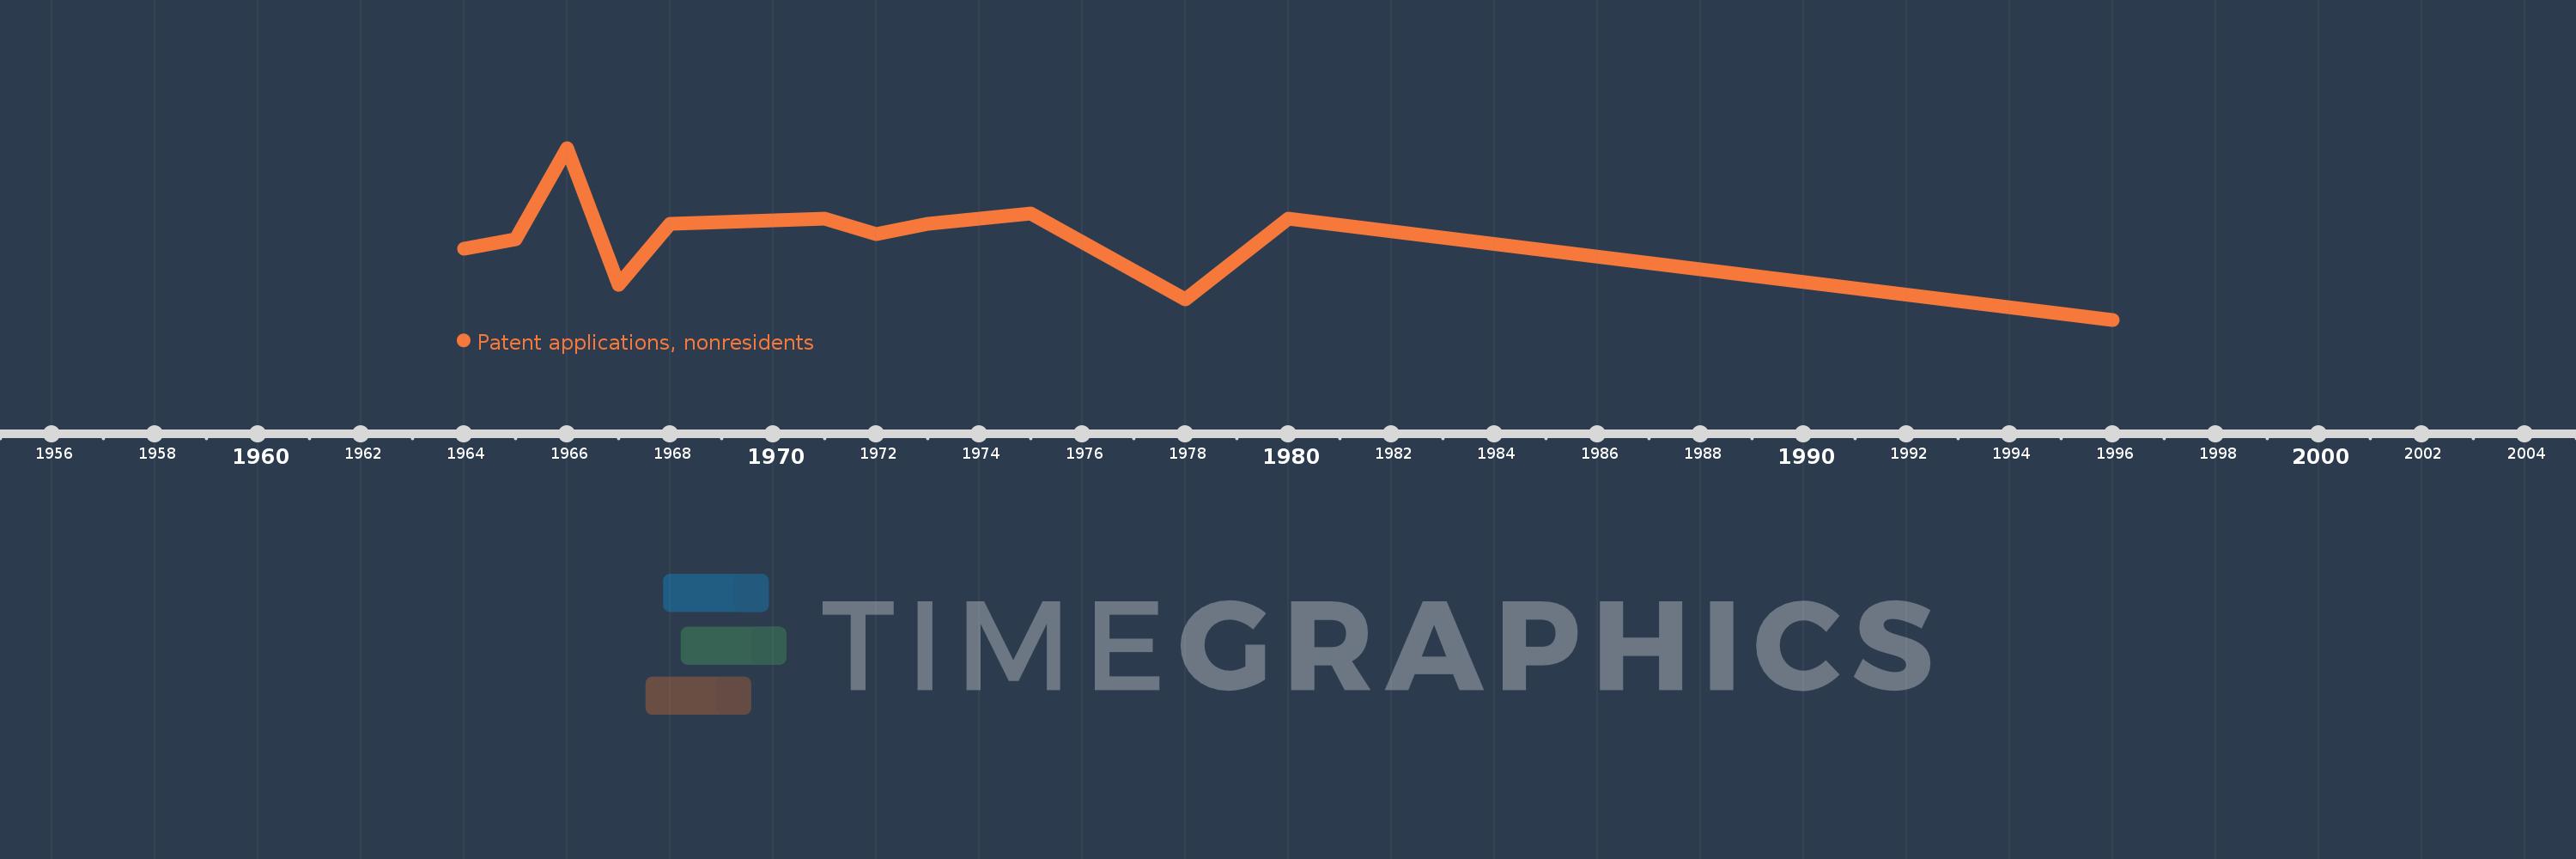
This timeline shows a graph from 1964 to 1996 of Sierra Leone. No data until 1963. Number of actual observations by date: 12.
Source name:
World Development Indicators
Source organization:
World Intellectual Property Organization (WIPO), WIPO Patent Report: Statistics on Worldwide Patent Activity. The International Bureau of WIPO assumes no responsibility with respect to the transformation of these data.
Categories, topics:
Science & Technology
Last updated:
apr 23, 2017
Indicators value changes by year
Meaning:
20.917
Minimum:
5.0
jan 1, 1996
Maximum:
39.0
jan 1, 1966
At the date of observation
Value
Absolute change
Change from the previous value
jan 1, 1964
19.0
+19.0
0.0%
jan 1, 1965
21.0
+2.0
10.53%
jan 1, 1966
39.0
+18.0
85.71%
jan 1, 1967
12.0
-27.0
-69.23%
jan 1, 1968
24.0
+12.0
100.0%
jan 1, 1971
25.0
+1.0
4.17%
jan 1, 1972
22.0
-3.0
-12.0%
jan 1, 1973
24.0
+2.0
9.09%
jan 1, 1975
26.0
+2.0
8.33%
jan 1, 1978
9.0
-17.0
-65.38%
jan 1, 1980
25.0
+16.0
177.78%
jan 1, 1996
5.0
-20.0
-80.0%
Ranking of countries by current statistics by years