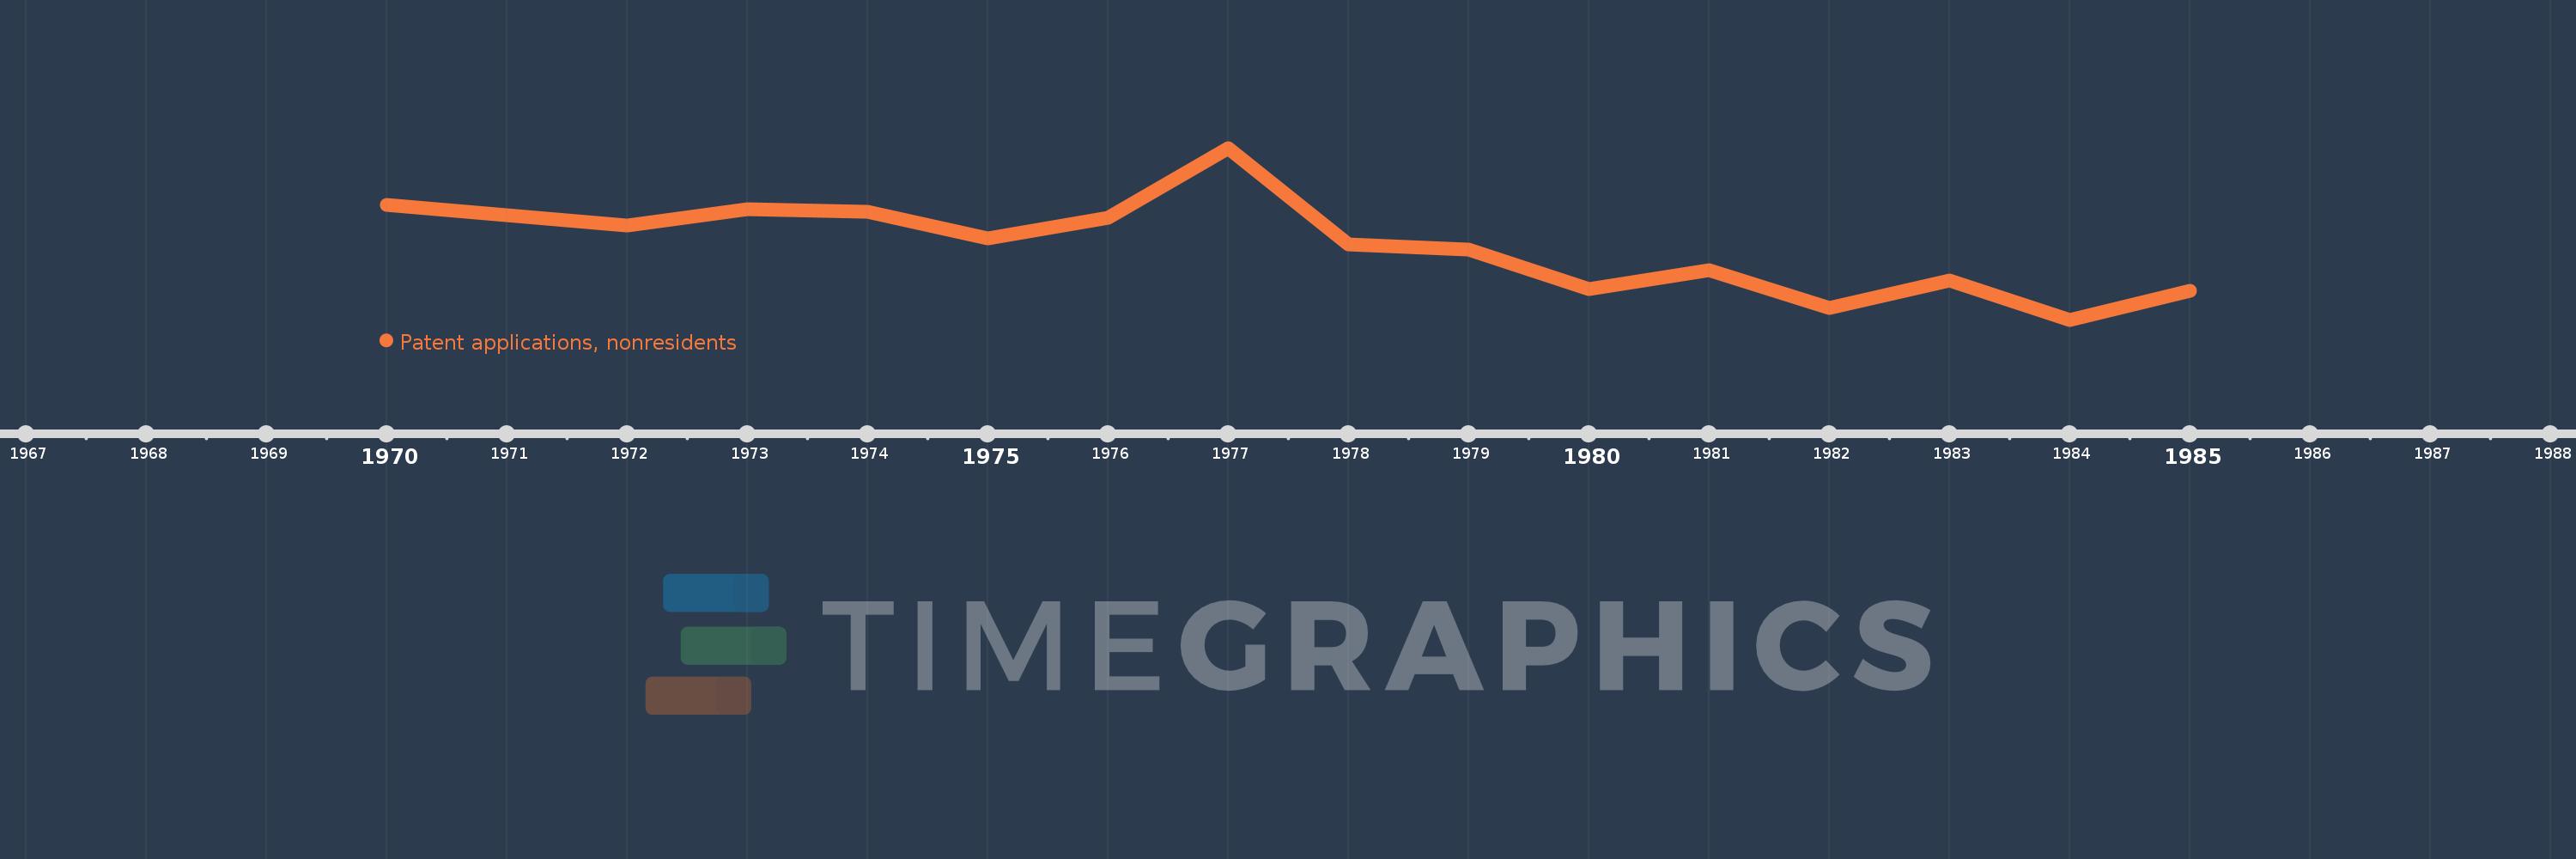
This timeline shows a graph from 1970 to 1985 of Congo, Dem. Rep.. No data until 1969. Number of actual observations by date: 15.
Source name:
World Development Indicators
Source organization:
World Intellectual Property Organization (WIPO), WIPO Patent Report: Statistics on Worldwide Patent Activity. The International Bureau of WIPO assumes no responsibility with respect to the transformation of these data.
Categories, topics:
Science & Technology
Last updated:
apr 23, 2017
Indicators value changes by year
Meaning:
115.867
Minimum:
66.0
jan 1, 1984
Maximum:
184.0
jan 1, 1977
At the date of observation
Value
Absolute change
Change from the previous value
jan 1, 1970
145.0
+145.0
0.0%
jan 1, 1972
131.0
-14.0
-9.66%
jan 1, 1973
142.0
+11.0
8.4%
jan 1, 1974
140.0
-2.0
-1.41%
jan 1, 1975
122.0
-18.0
-12.86%
jan 1, 1976
136.0
+14.0
11.48%
jan 1, 1977
184.0
+48.0
35.29%
jan 1, 1978
118.0
-66.0
-35.87%
jan 1, 1979
114.0
-4.0
-3.39%
jan 1, 1980
87.0
-27.0
-23.68%
jan 1, 1981
100.0
+13.0
14.94%
jan 1, 1982
74.0
-26.0
-26.0%
jan 1, 1983
93.0
+19.0
25.68%
jan 1, 1984
66.0
-27.0
-29.03%
jan 1, 1985
86.0
+20.0
30.3%
Ranking of countries by current statistics by years