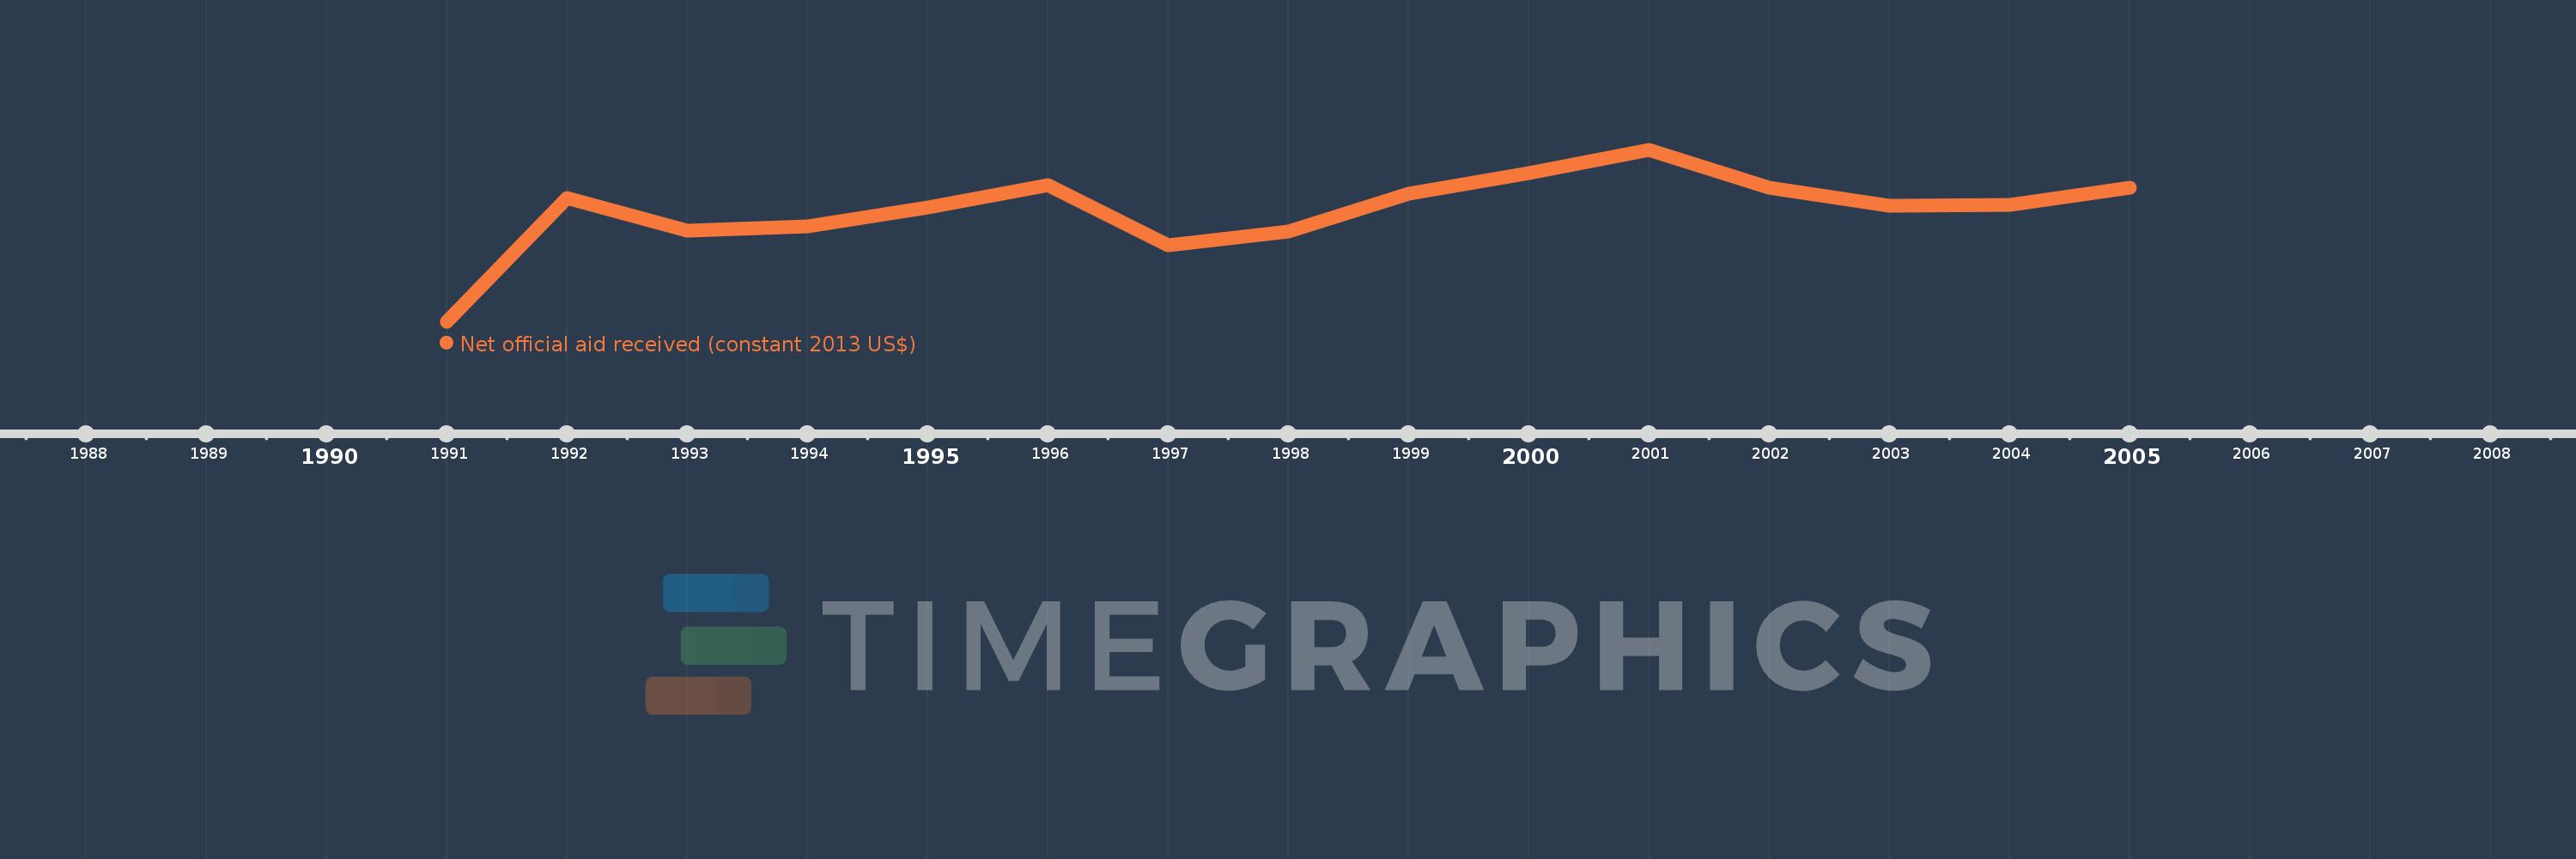
This timeline shows a graph from 1991 to 2005 of World. No data until 1990. Number of actual observations by date: 15.
Source name:
World Development Indicators
Source organization:
Development Assistance Committee of the Organisation for Economic Co-operation and Development, Geographical Distribution of Financial Flows to Developing Countries, Development Co-operation Report, and International Development Statistics database. Data are available online at: www.oecd.org/dac/stats/idsonline.
Categories, topics:
Aid Effectiveness
Last updated:
apr 23, 2017
Indicators value changes by year
Meaning:
9.797 bln
Minimum:
3.583 bln
jan 1, 1991
Maximum:
13.116 bln
jan 1, 2001
At the date of observation
Value
Absolute change
Change from the previous value
jan 1, 1991
3.583 bln
+3.583 bln
0.0%
jan 1, 1992
10.464 bln
+6.881 bln
192.04%
jan 1, 1993
8.661 bln
-1.804 bln
-17.24%
jan 1, 1994
8.908 bln
+247.23 mln
2.85%
jan 1, 1995
9.938 bln
+1.03 bln
11.56%
jan 1, 1996
11.187 bln
+1.25 bln
12.58%
jan 1, 1997
7.826 bln
-3.362 bln
-30.05%
jan 1, 1998
8.588 bln
+762.34 mln
9.74%
jan 1, 1999
10.69 bln
+2.102 bln
24.47%
jan 1, 2000
11.833 bln
+1.143 bln
10.69%
jan 1, 2001
13.116 bln
+1.283 bln
10.85%
jan 1, 2002
11.045 bln
-2.071 bln
-15.79%
jan 1, 2003
10.022 bln
-1.024 bln
-9.27%
jan 1, 2004
10.068 bln
+46.35 mln
0.46%
jan 1, 2005
11.029 bln
+961.05 mln
9.55%
Ranking of countries by current statistics by years