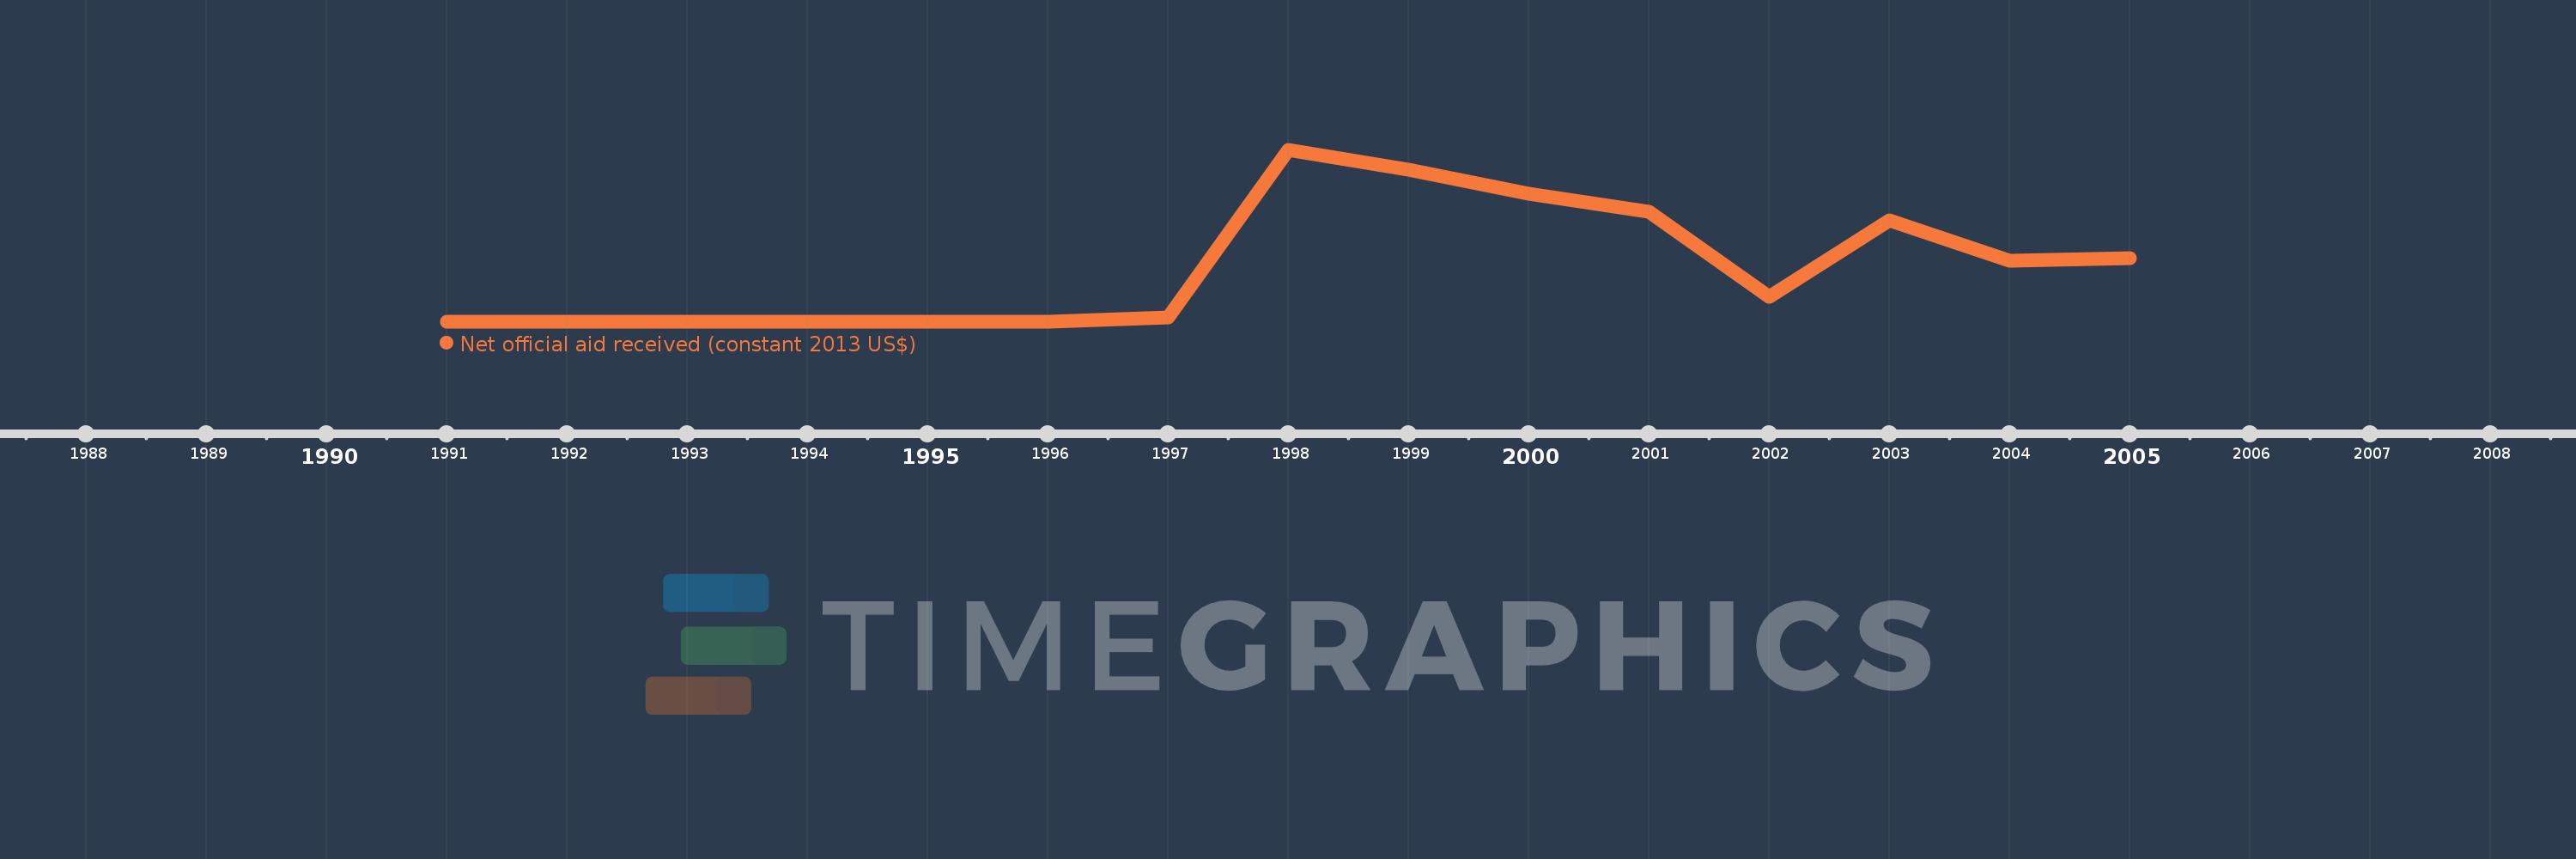
This timeline shows a graph from 1991 to 2005 of Middle East & North Africa. No data until 1990. Number of actual observations by date: 15.
Source name:
World Development Indicators
Source organization:
Development Assistance Committee of the Organisation for Economic Co-operation and Development, Geographical Distribution of Financial Flows to Developing Countries, Development Co-operation Report, and International Development Statistics database. Data are available online at: www.oecd.org/dac/stats/idsonline.
Categories, topics:
Aid Effectiveness
Last updated:
apr 23, 2017
Indicators value changes by year
Meaning:
523.259 mln
Minimum:
0.0
jan 1, 1991
Maximum:
1.646 bln
jan 1, 1998
At the date of observation
Value
Absolute change
Change from the previous value
jan 1, 1991
0.0
0.0
0.0%
jan 1, 1992
0.0
0.0
%
jan 1, 1993
0.0
0.0
%
jan 1, 1994
0.0
0.0
%
jan 1, 1995
0.0
0.0
%
jan 1, 1996
0.0
0.0
%
jan 1, 1997
44.44 mln
+44.44 mln
%
jan 1, 1998
1.646 bln
+1.601 bln
3.6K%
jan 1, 1999
1.462 bln
-183.84 mln
-11.17%
jan 1, 2000
1.225 bln
-237.09 mln
-16.22%
jan 1, 2001
1.057 bln
-168.11 mln
-13.73%
jan 1, 2002
244.35 mln
-812.34 mln
-76.88%
jan 1, 2003
974.72 mln
+730.37 mln
298.9%
jan 1, 2004
583.64 mln
-391.08 mln
-40.12%
jan 1, 2005
612.63 mln
+28.99 mln
4.97%
Ranking of countries by current statistics by years