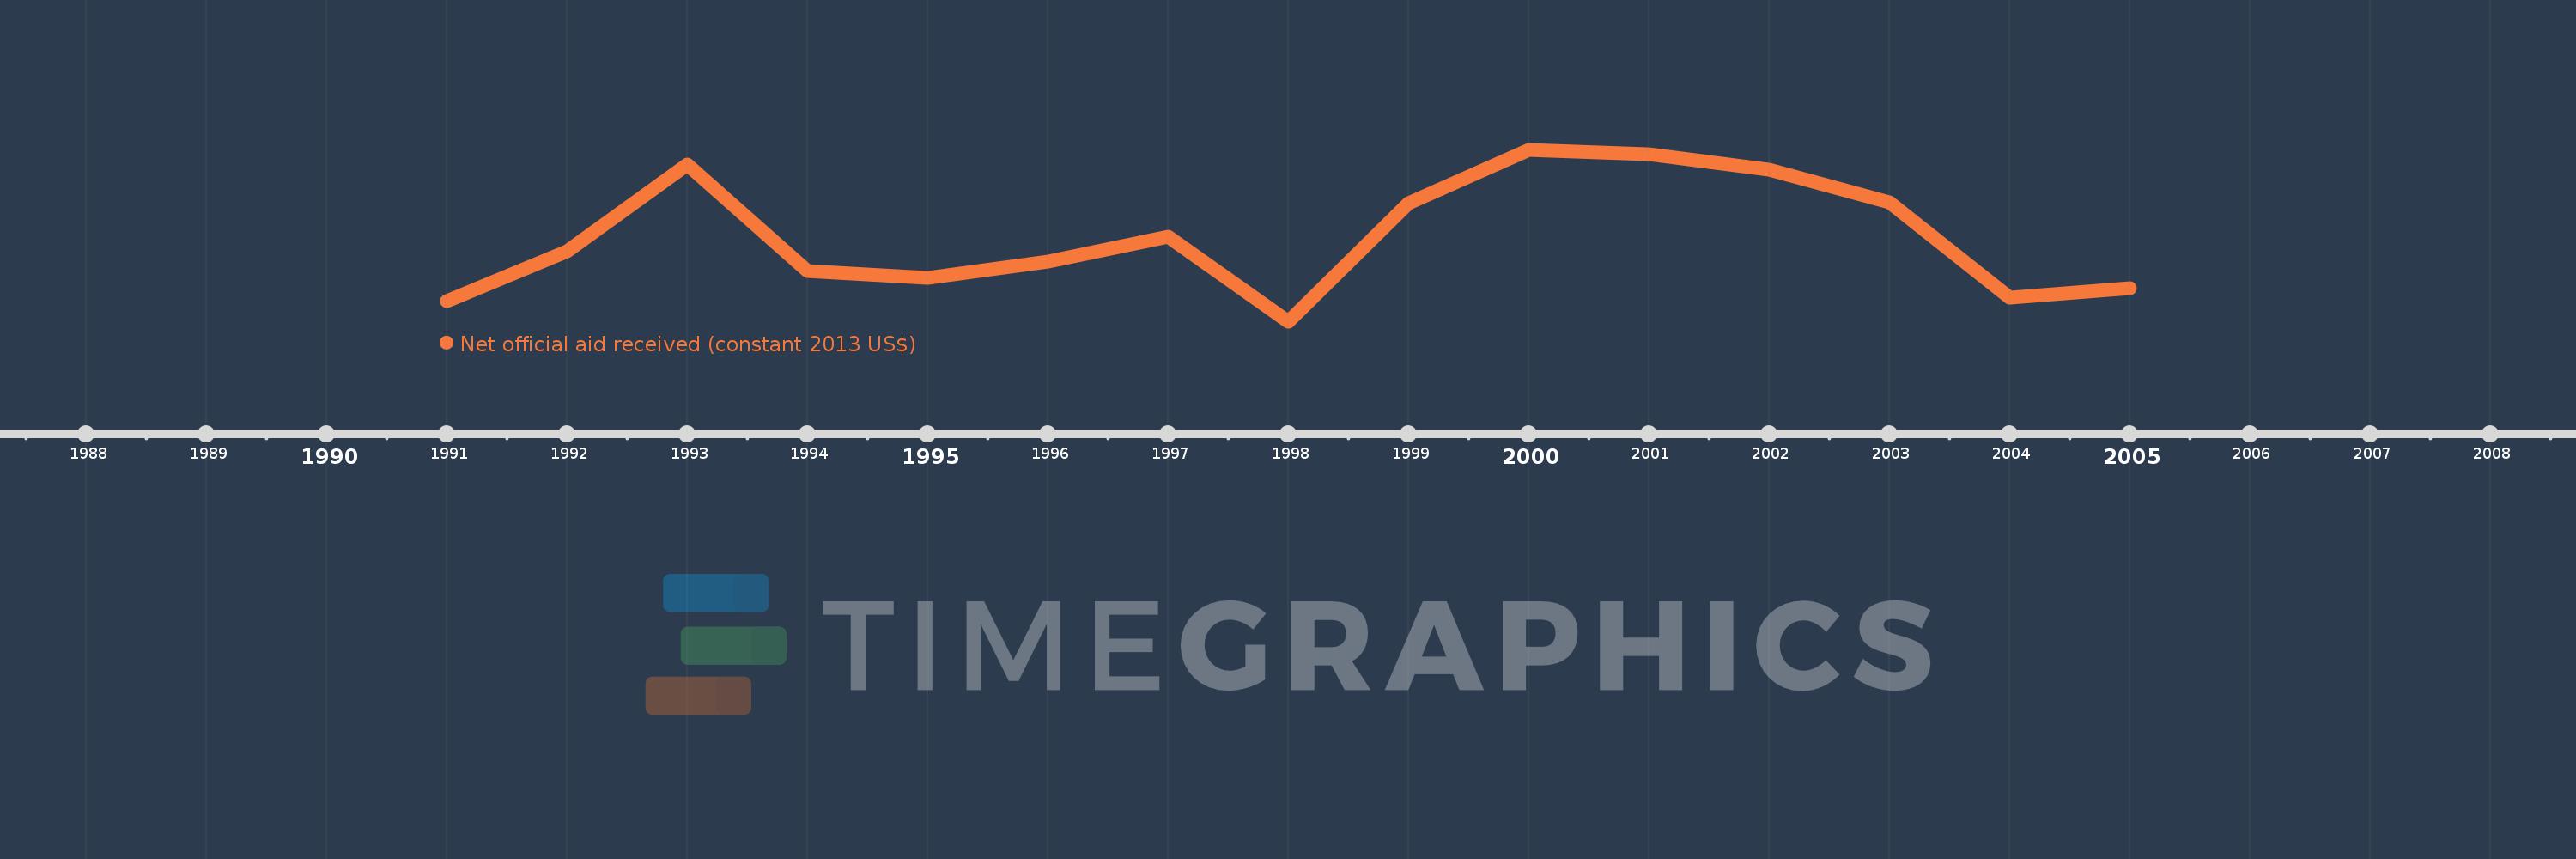
This timeline shows a graph from 1991 to 2005 of Lower middle income. No data until 1990. Number of actual observations by date: 15.
Source name:
World Development Indicators
Source organization:
Development Assistance Committee of the Organisation for Economic Co-operation and Development, Geographical Distribution of Financial Flows to Developing Countries, Development Co-operation Report, and International Development Statistics database. Data are available online at: www.oecd.org/dac/stats/idsonline.
Categories, topics:
Aid Effectiveness
Last updated:
apr 23, 2017
Indicators value changes by year
Meaning:
597.3 mln
Minimum:
384.74 mln
jan 1, 1998
Maximum:
813.48 mln
jan 1, 2000
At the date of observation
Value
Absolute change
Change from the previous value
jan 1, 1991
436.84 mln
+436.84 mln
0.0%
jan 1, 1992
561.58 mln
+124.74 mln
28.56%
jan 1, 1993
777.47 mln
+215.89 mln
38.44%
jan 1, 1994
511.05 mln
-266.42 mln
-34.27%
jan 1, 1995
494.47 mln
-16.58 mln
-3.24%
jan 1, 1996
535.55 mln
+41.08 mln
8.31%
jan 1, 1997
597.62 mln
+62.07 mln
11.59%
jan 1, 1998
384.74 mln
-212.88 mln
-35.62%
jan 1, 1999
681.27 mln
+296.53 mln
77.07%
jan 1, 2000
813.48 mln
+132.21 mln
19.41%
jan 1, 2001
803.72 mln
-9.76 mln
-1.2%
jan 1, 2002
763.92 mln
-39.8 mln
-4.95%
jan 1, 2003
683.73 mln
-80.19 mln
-10.5%
jan 1, 2004
444.67 mln
-239.06 mln
-34.96%
jan 1, 2005
469.39 mln
+24.72 mln
5.56%
Ranking of countries by current statistics by years