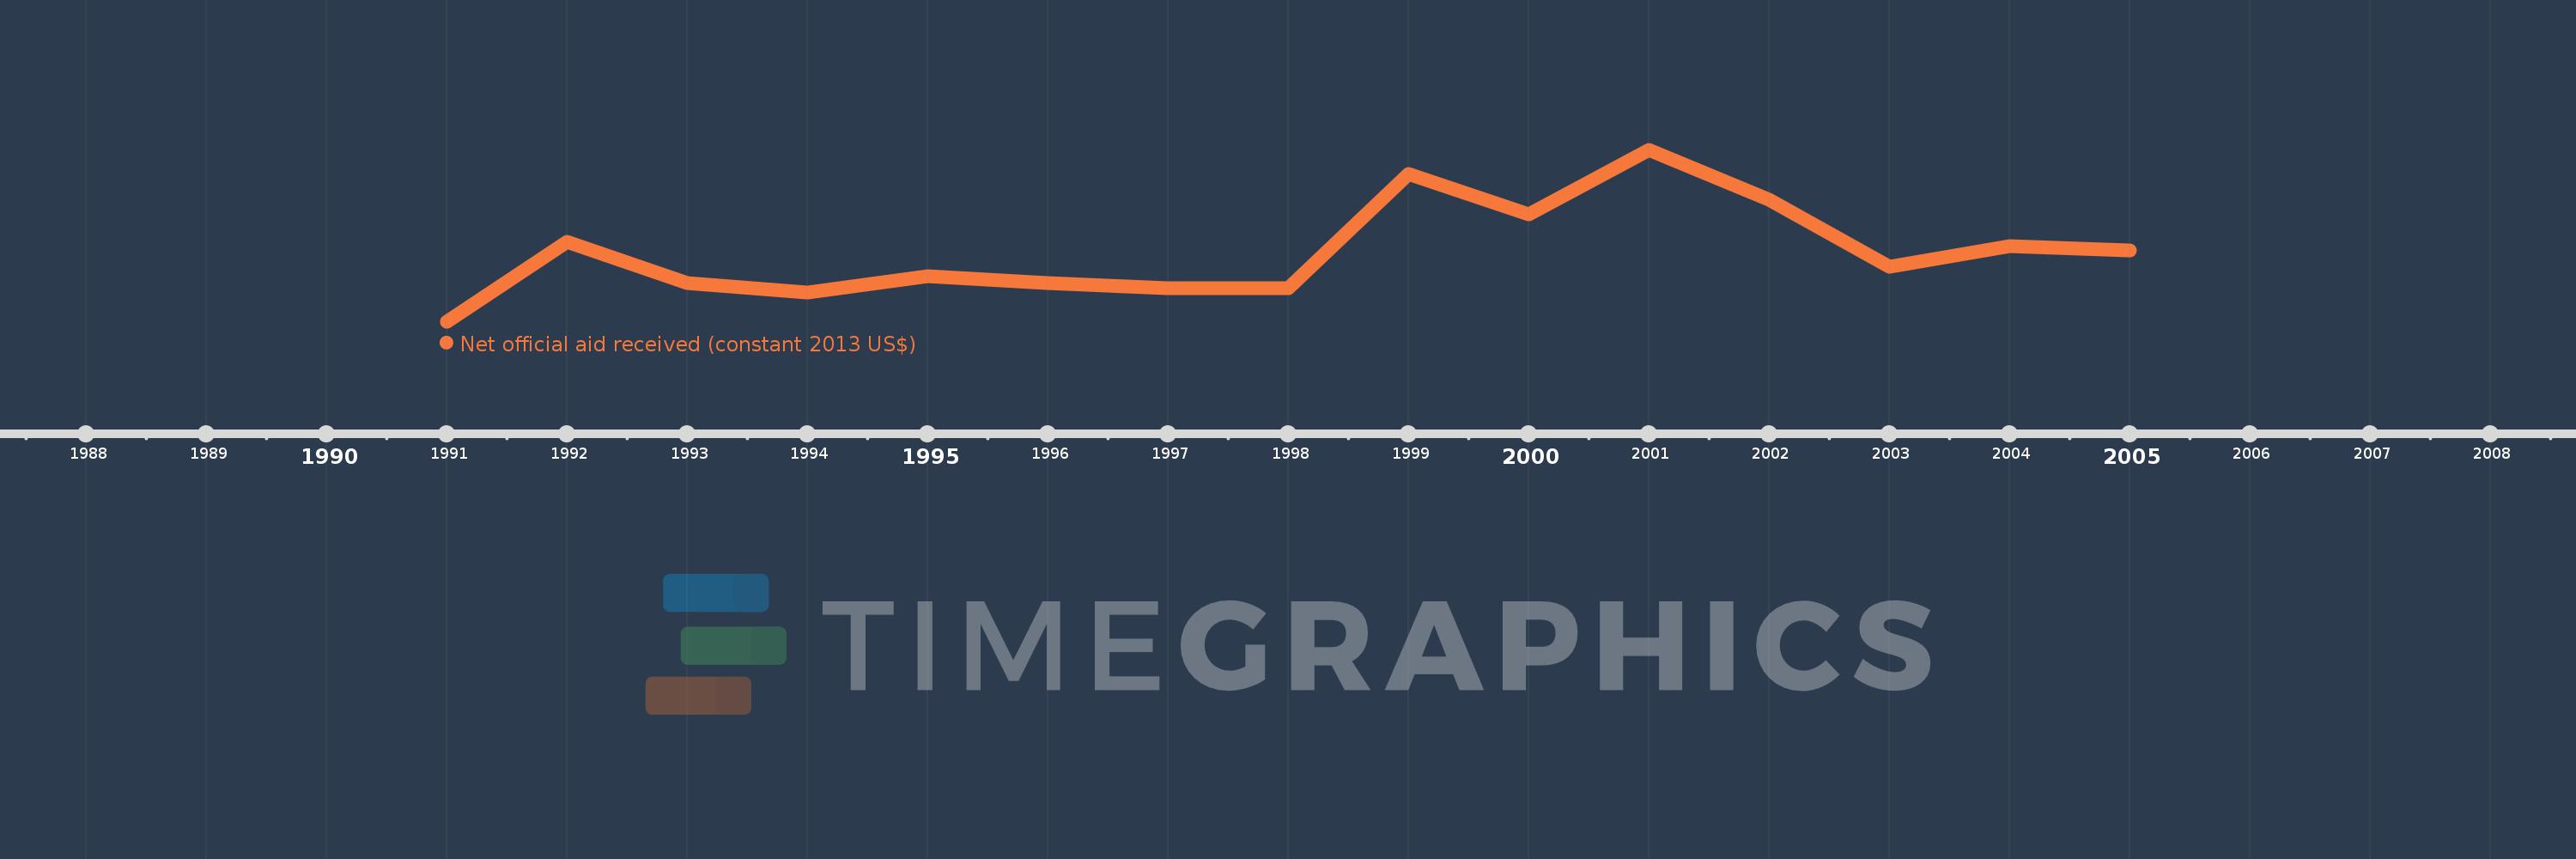
This timeline shows a graph from 1991 to 2005 of Czech Republic. No data until 1990. Number of actual observations by date: 15.
Source name:
World Development Indicators
Source organization:
Development Assistance Committee of the Organisation for Economic Co-operation and Development, Geographical Distribution of Financial Flows to Developing Countries, Development Co-operation Report, and International Development Statistics database. Data are available online at: www.oecd.org/dac/stats/idsonline.
Categories, topics:
Aid Effectiveness
Last updated:
apr 23, 2017
Indicators value changes by year
Meaning:
334.021 mln
Minimum:
23.05 mln
jan 1, 1991
Maximum:
784.27 mln
jan 1, 2001
At the date of observation
Value
Absolute change
Change from the previous value
jan 1, 1991
23.05 mln
+23.05 mln
0.0%
jan 1, 1992
379.02 mln
+355.97 mln
1.54K%
jan 1, 1993
195.4 mln
-183.62 mln
-48.45%
jan 1, 1994
154.79 mln
-40.61 mln
-20.78%
jan 1, 1995
226.35 mln
+71.56 mln
46.23%
jan 1, 1996
194.91 mln
-31.44 mln
-13.89%
jan 1, 1997
171.95 mln
-22.96 mln
-11.78%
jan 1, 1998
171.57 mln
-380.0K
-0.22%
jan 1, 1999
678.93 mln
+507.36 mln
295.72%
jan 1, 2000
499.69 mln
-179.24 mln
-26.4%
jan 1, 2001
784.27 mln
+284.58 mln
56.95%
jan 1, 2002
564.29 mln
-219.98 mln
-28.05%
jan 1, 2003
266.96 mln
-297.33 mln
-52.69%
jan 1, 2004
359.17 mln
+92.21 mln
34.54%
jan 1, 2005
339.96 mln
-19.21 mln
-5.35%
Ranking of countries by current statistics by years