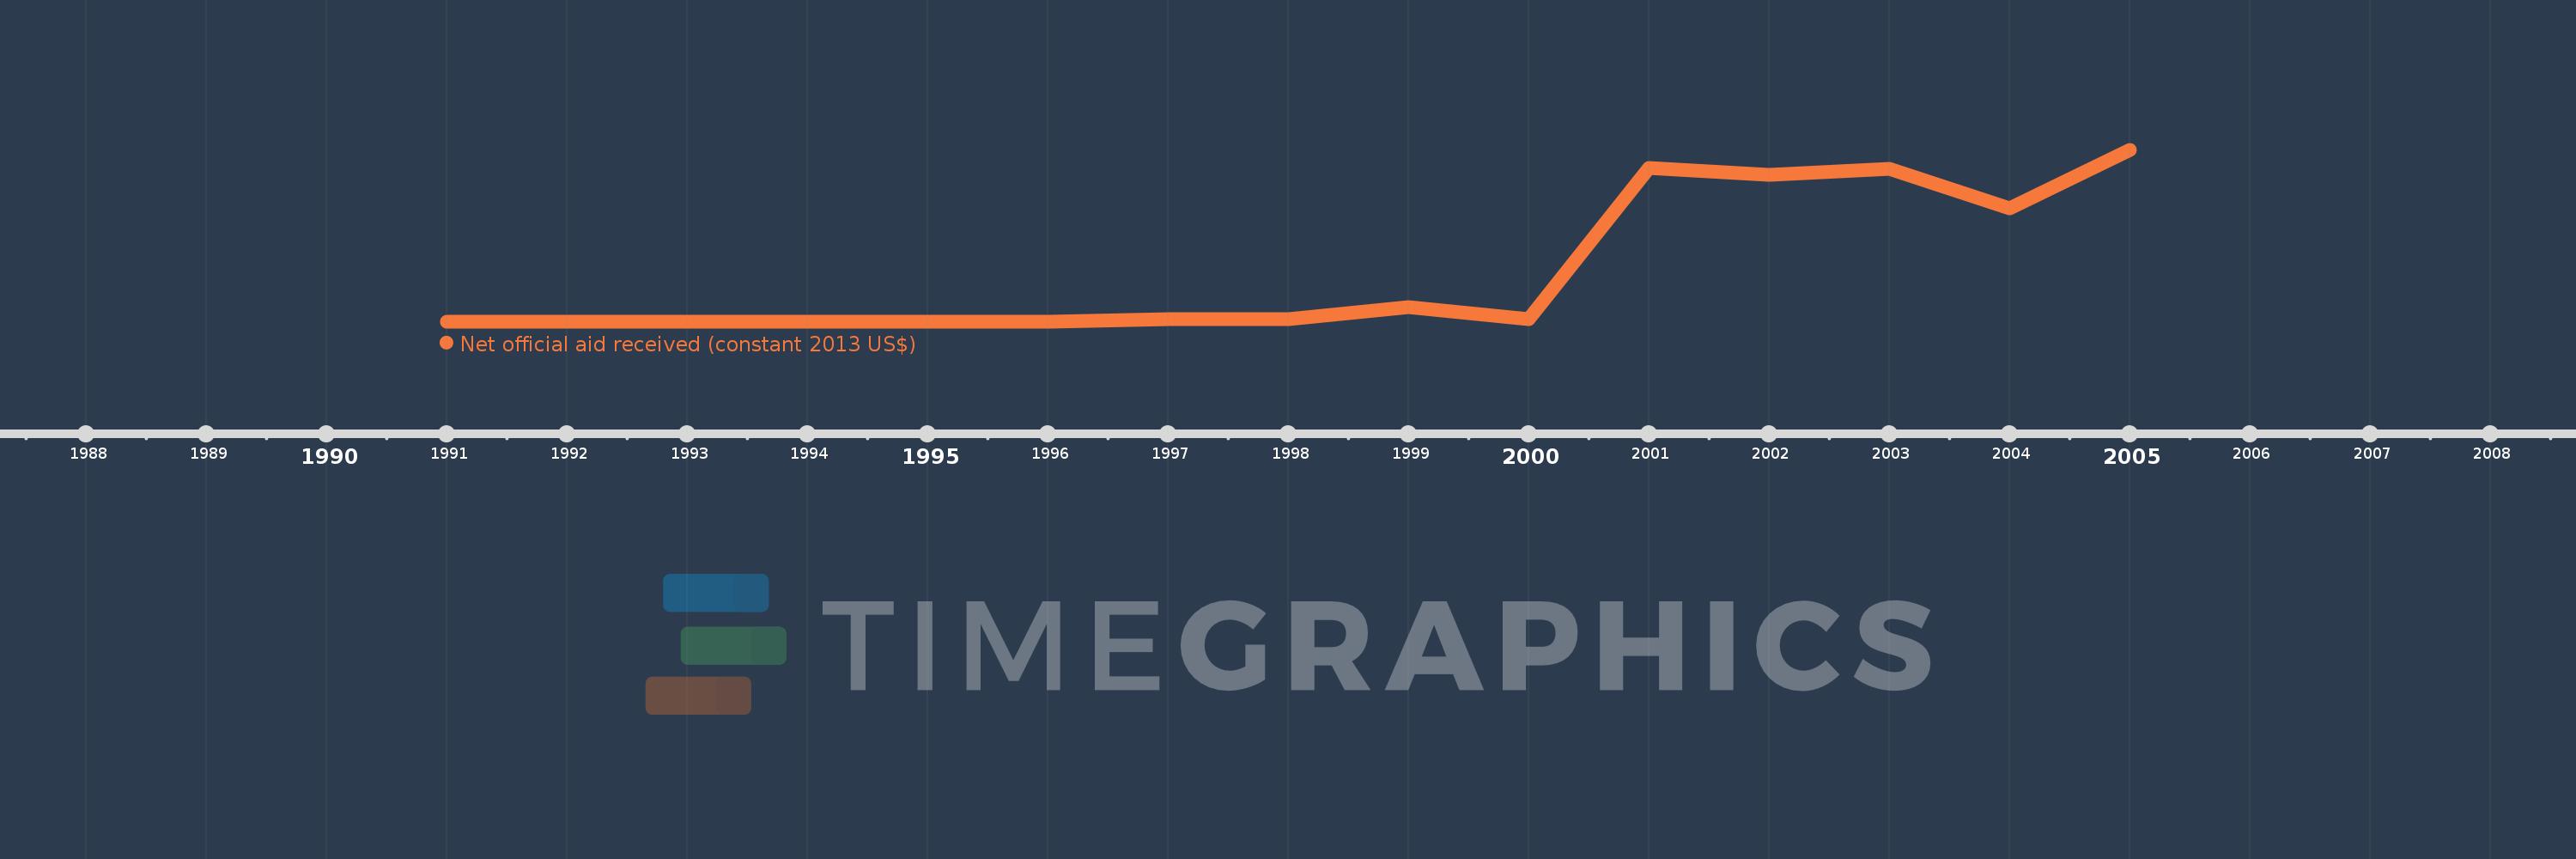
This timeline shows a graph from 1991 to 2005 of East Asia & Pacific. No data until 1990. Number of actual observations by date: 15.
Source name:
World Development Indicators
Source organization:
Development Assistance Committee of the Organisation for Economic Co-operation and Development, Geographical Distribution of Financial Flows to Developing Countries, Development Co-operation Report, and International Development Statistics database. Data are available online at: www.oecd.org/dac/stats/idsonline.
Categories, topics:
Aid Effectiveness
Last updated:
apr 23, 2017
Indicators value changes by year
Meaning:
389.018 mln
Minimum:
0.0
jan 1, 1991
Maximum:
1.314 bln
jan 1, 2005
At the date of observation
Value
Absolute change
Change from the previous value
jan 1, 1991
0.0
0.0
0.0%
jan 1, 1992
0.0
0.0
%
jan 1, 1993
0.0
0.0
%
jan 1, 1994
0.0
0.0
%
jan 1, 1995
0.0
0.0
%
jan 1, 1996
0.0
0.0
%
jan 1, 1997
19.49 mln
+19.49 mln
%
jan 1, 1998
23.54 mln
+4.05 mln
20.78%
jan 1, 1999
111.56 mln
+88.02 mln
373.92%
jan 1, 2000
24.9 mln
-86.66 mln
-77.68%
jan 1, 2001
1.179 bln
+1.154 bln
4.64K%
jan 1, 2002
1.123 bln
-56.81 mln
-4.82%
jan 1, 2003
1.171 bln
+48.8 mln
4.35%
jan 1, 2004
868.78 mln
-302.56 mln
-25.83%
jan 1, 2005
1.314 bln
+444.99 mln
51.22%
Ranking of countries by current statistics by years