Download This statistics in other country:
Timeline:
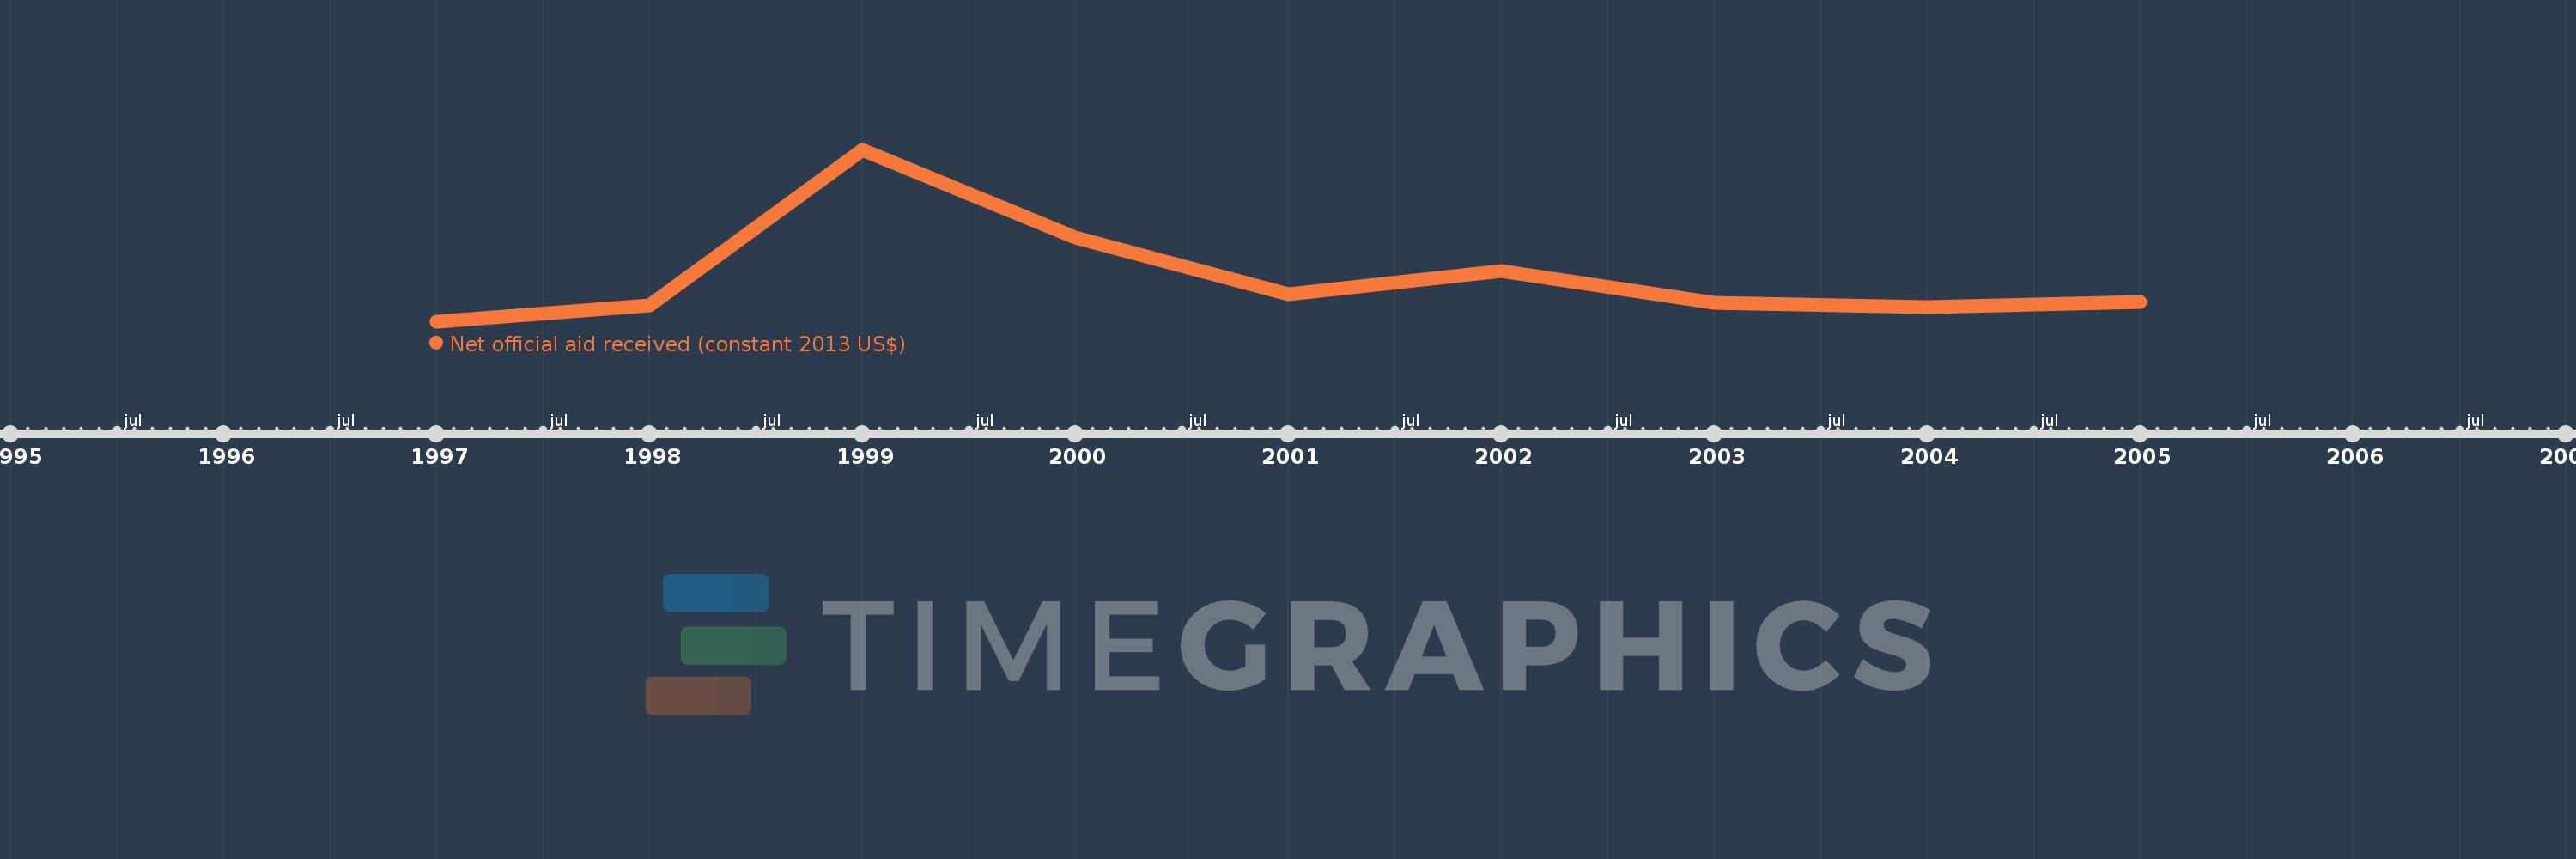
This timeline shows a graph from 1997 to 2005 of Caribbean small states. No data until 1996. Number of actual observations by date: 9.
Source name:
World Development Indicators
Source organization:
Development Assistance Committee of the Organisation for Economic Co-operation and Development, Geographical Distribution of Financial Flows to Developing Countries, Development Co-operation Report, and International Development Statistics database. Data are available online at: www.oecd.org/dac/stats/idsonline.
Categories, topics:
Aid Effectiveness
Last updated:
apr 23, 2017
Indicators value changes by year
Minimum:
1.95 mln
jan 1, 1997
Maximum:
34.35 mln
jan 1, 1999
At the date of observation
Value
Absolute change
Change from the previous value
jan 1, 1997
1.95 mln
+1.95 mln
0.0%
jan 1, 1998
5.07 mln
+3.12 mln
160.0%
jan 1, 1999
34.35 mln
+29.28 mln
577.51%
jan 1, 2000
17.93 mln
-16.42 mln
-47.8%
jan 1, 2001
7.19 mln
-10.74 mln
-59.9%
jan 1, 2002
11.48 mln
+4.29 mln
59.67%
jan 1, 2003
5.62 mln
-5.86 mln
-51.05%
jan 1, 2004
4.74 mln
-880.0K
-15.66%
jan 1, 2005
5.66 mln
+920.0K
19.41%
Ranking of countries by current statistics by years