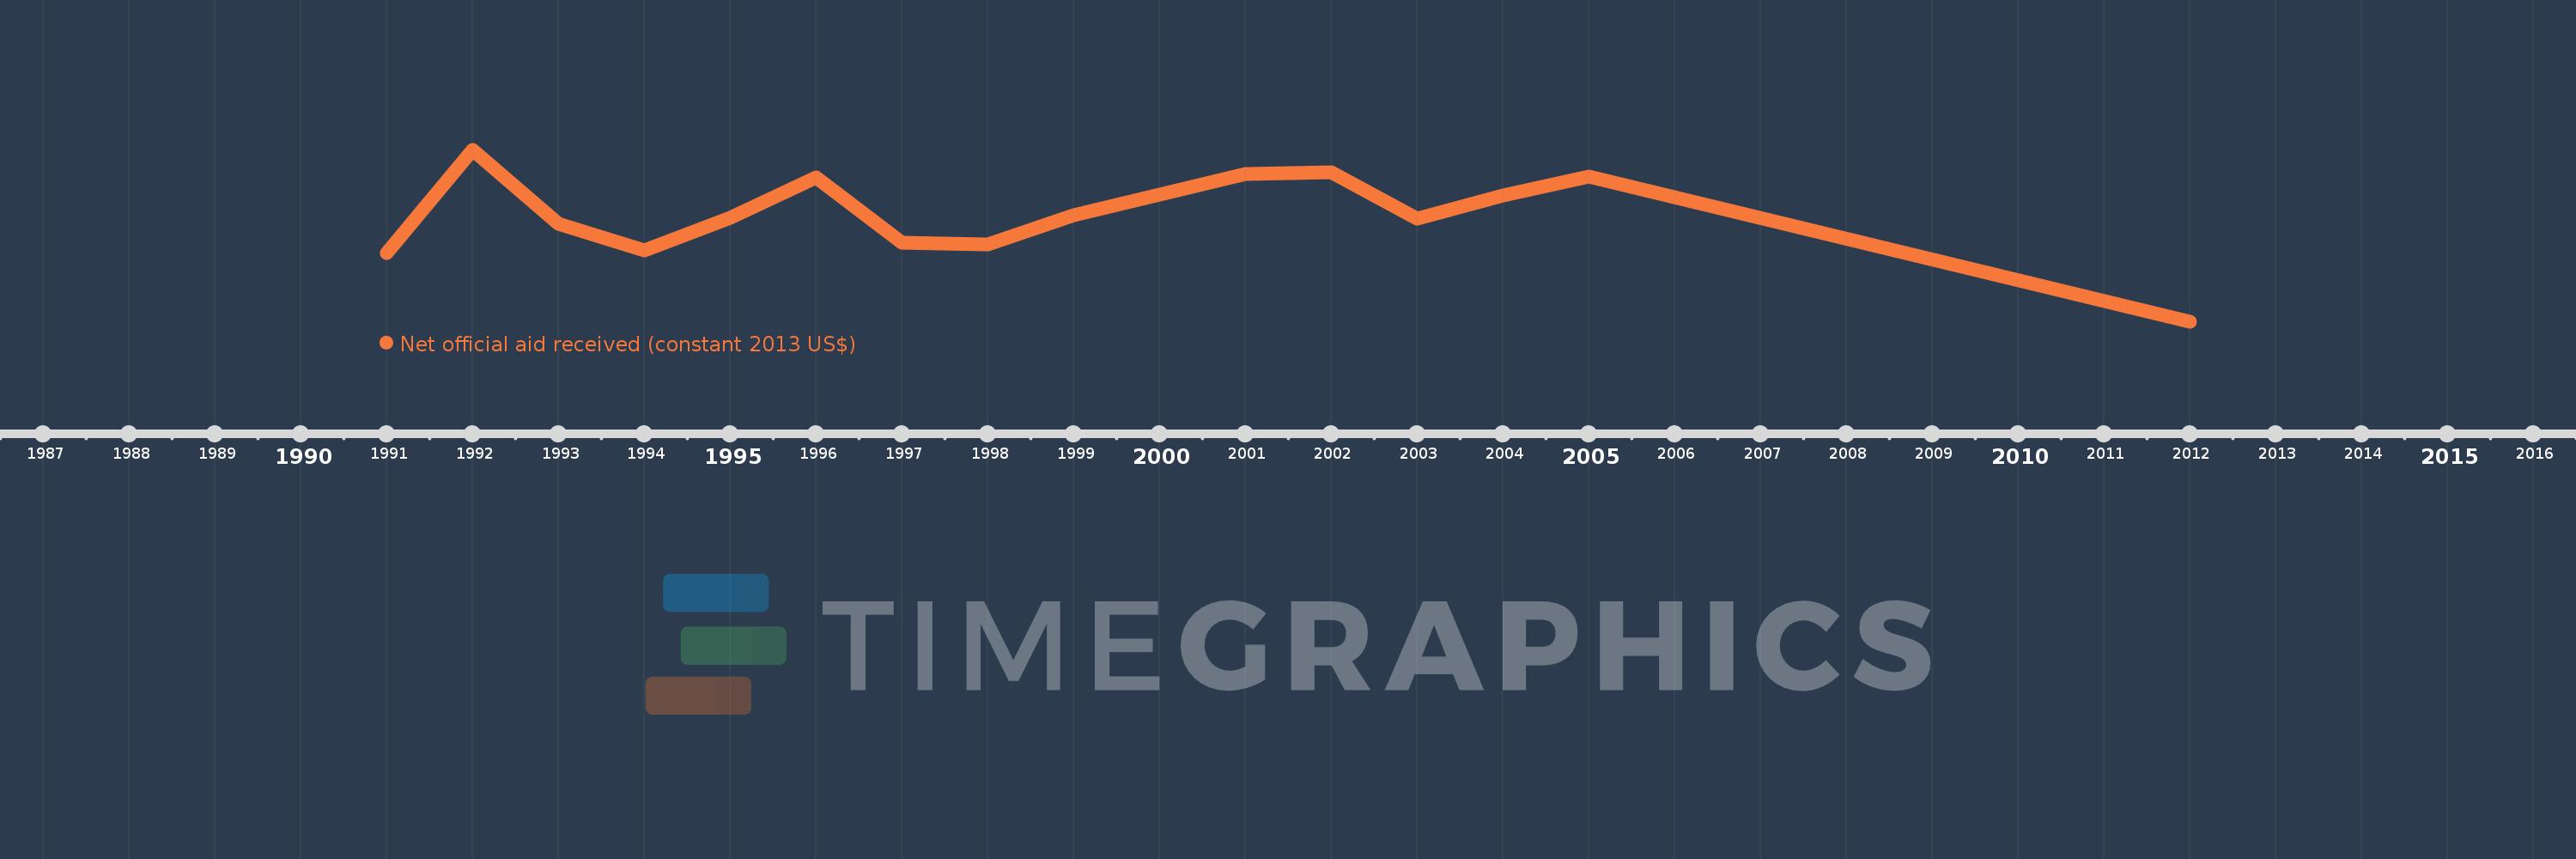
This timeline shows a graph from 1991 to 2012 of European Union. No data until 1990. Number of actual observations by date: 16.
Source name:
World Development Indicators
Source organization:
Development Assistance Committee of the Organisation for Economic Co-operation and Development, Geographical Distribution of Financial Flows to Developing Countries, Development Co-operation Report, and International Development Statistics database. Data are available online at: www.oecd.org/dac/stats/idsonline.
Categories, topics:
Aid Effectiveness
Last updated:
apr 23, 2017
Indicators value changes by year
Meaning:
4.124 bln
Minimum:
280.0K
jan 1, 2012
Maximum:
6.579 bln
jan 1, 1992
At the date of observation
Value
Absolute change
Change from the previous value
jan 1, 1991
2.63 bln
+2.63 bln
0.0%
jan 1, 1992
6.579 bln
+3.949 bln
150.17%
jan 1, 1993
3.756 bln
-2.823 bln
-42.91%
jan 1, 1994
2.74 bln
-1.016 bln
-27.05%
jan 1, 1995
3.993 bln
+1.253 bln
45.73%
jan 1, 1996
5.535 bln
+1.543 bln
38.63%
jan 1, 1997
3.029 bln
-2.506 bln
-45.27%
jan 1, 1998
2.956 bln
-73.1 mln
-2.41%
jan 1, 1999
4.086 bln
+1.13 bln
38.22%
jan 1, 2000
4.874 bln
+788.14 mln
19.29%
jan 1, 2001
5.664 bln
+790.09 mln
16.21%
jan 1, 2002
5.744 bln
+79.7 mln
1.41%
jan 1, 2003
3.959 bln
-1.785 bln
-31.07%
jan 1, 2004
4.859 bln
+900.17 mln
22.74%
jan 1, 2005
5.584 bln
+724.1 mln
14.9%
jan 1, 2012
280.0K
-5.583 bln
-99.99%
Ranking of countries by current statistics by years