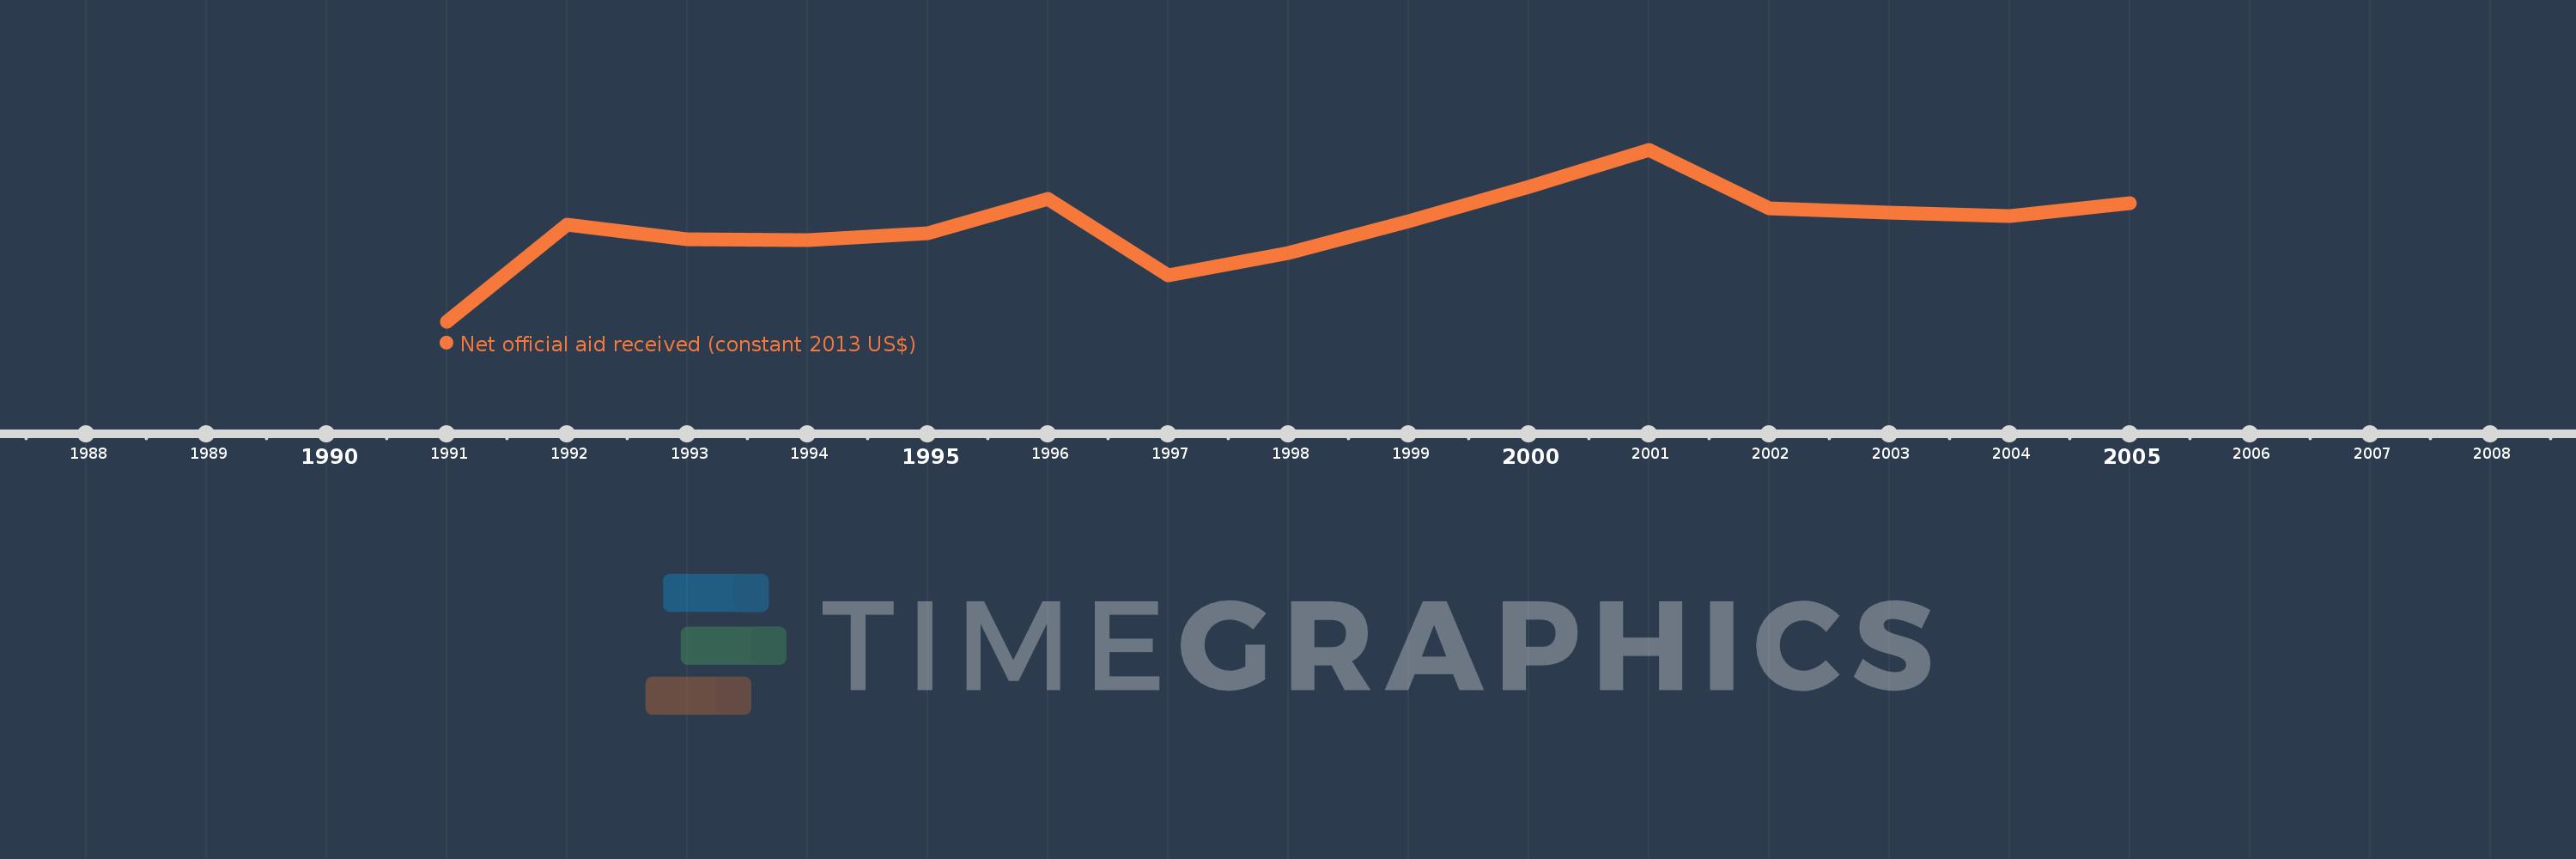
This timeline shows a graph from 1991 to 2005 of High income. No data until 1990. Number of actual observations by date: 15.
Source name:
World Development Indicators
Source organization:
Development Assistance Committee of the Organisation for Economic Co-operation and Development, Geographical Distribution of Financial Flows to Developing Countries, Development Co-operation Report, and International Development Statistics database. Data are available online at: www.oecd.org/dac/stats/idsonline.
Categories, topics:
Aid Effectiveness
Last updated:
apr 23, 2017
Indicators value changes by year
Meaning:
6.373 bln
Minimum:
2.6 bln
jan 1, 1991
Maximum:
9.334 bln
jan 1, 2001
At the date of observation
Value
Absolute change
Change from the previous value
jan 1, 1991
2.6 bln
+2.6 bln
0.0%
jan 1, 1992
6.416 bln
+3.816 bln
146.78%
jan 1, 1993
5.833 bln
-583.37 mln
-9.09%
jan 1, 1994
5.793 bln
-39.21 mln
-0.67%
jan 1, 1995
6.082 bln
+288.73 mln
4.98%
jan 1, 1996
7.433 bln
+1.351 bln
22.22%
jan 1, 1997
4.438 bln
-2.995 bln
-40.29%
jan 1, 1998
5.293 bln
+854.8 mln
19.26%
jan 1, 1999
6.534 bln
+1.241 bln
23.44%
jan 1, 2000
7.882 bln
+1.348 bln
20.64%
jan 1, 2001
9.334 bln
+1.452 bln
18.43%
jan 1, 2002
7.071 bln
-2.263 bln
-24.25%
jan 1, 2003
6.894 bln
-176.29 mln
-2.49%
jan 1, 2004
6.738 bln
-156.67 mln
-2.27%
jan 1, 2005
7.259 bln
+521.14 mln
7.73%
Ranking of countries by current statistics by years