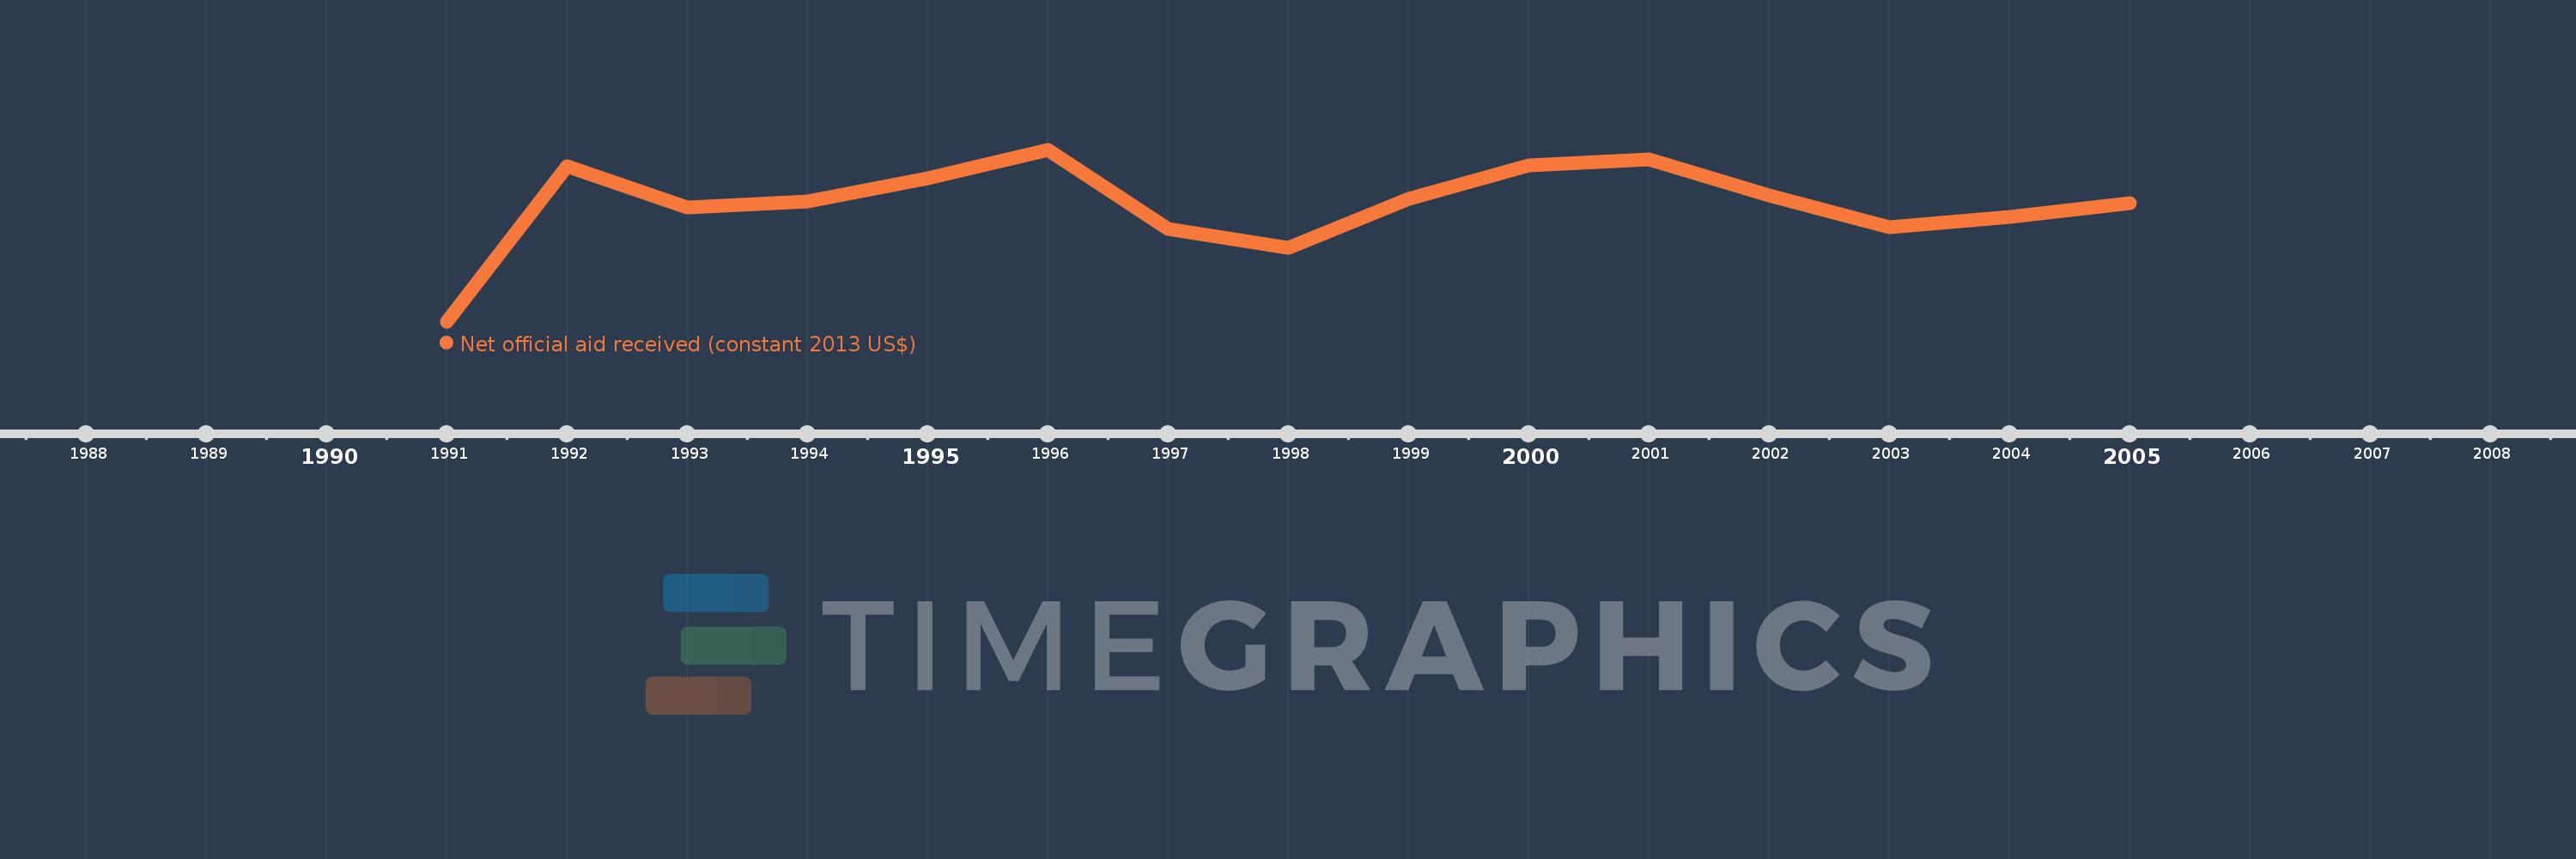
This timeline shows a graph from 1991 to 2005 of Europe & Central Asia. No data until 1990. Number of actual observations by date: 15.
Source name:
World Development Indicators
Source organization:
Development Assistance Committee of the Organisation for Economic Co-operation and Development, Geographical Distribution of Financial Flows to Developing Countries, Development Co-operation Report, and International Development Statistics database. Data are available online at: www.oecd.org/dac/stats/idsonline.
Categories, topics:
Aid Effectiveness
Last updated:
apr 23, 2017
Indicators value changes by year
Meaning:
8.778 bln
Minimum:
3.583 bln
jan 1, 1991
Maximum:
11.187 bln
jan 1, 1996
At the date of observation
Value
Absolute change
Change from the previous value
jan 1, 1991
3.583 bln
+3.583 bln
0.0%
jan 1, 1992
10.464 bln
+6.881 bln
192.04%
jan 1, 1993
8.661 bln
-1.804 bln
-17.24%
jan 1, 1994
8.908 bln
+247.23 mln
2.85%
jan 1, 1995
9.938 bln
+1.03 bln
11.56%
jan 1, 1996
11.187 bln
+1.25 bln
12.58%
jan 1, 1997
7.683 bln
-3.505 bln
-31.33%
jan 1, 1998
6.874 bln
-808.53 mln
-10.52%
jan 1, 1999
9.047 bln
+2.173 bln
31.61%
jan 1, 2000
10.526 bln
+1.478 bln
16.34%
jan 1, 2001
10.772 bln
+245.72 mln
2.33%
jan 1, 2002
9.165 bln
-1.607 bln
-14.91%
jan 1, 2003
7.766 bln
-1.399 bln
-15.26%
jan 1, 2004
8.248 bln
+481.86 mln
6.2%
jan 1, 2005
8.842 bln
+594.25 mln
7.2%
Ranking of countries by current statistics by years