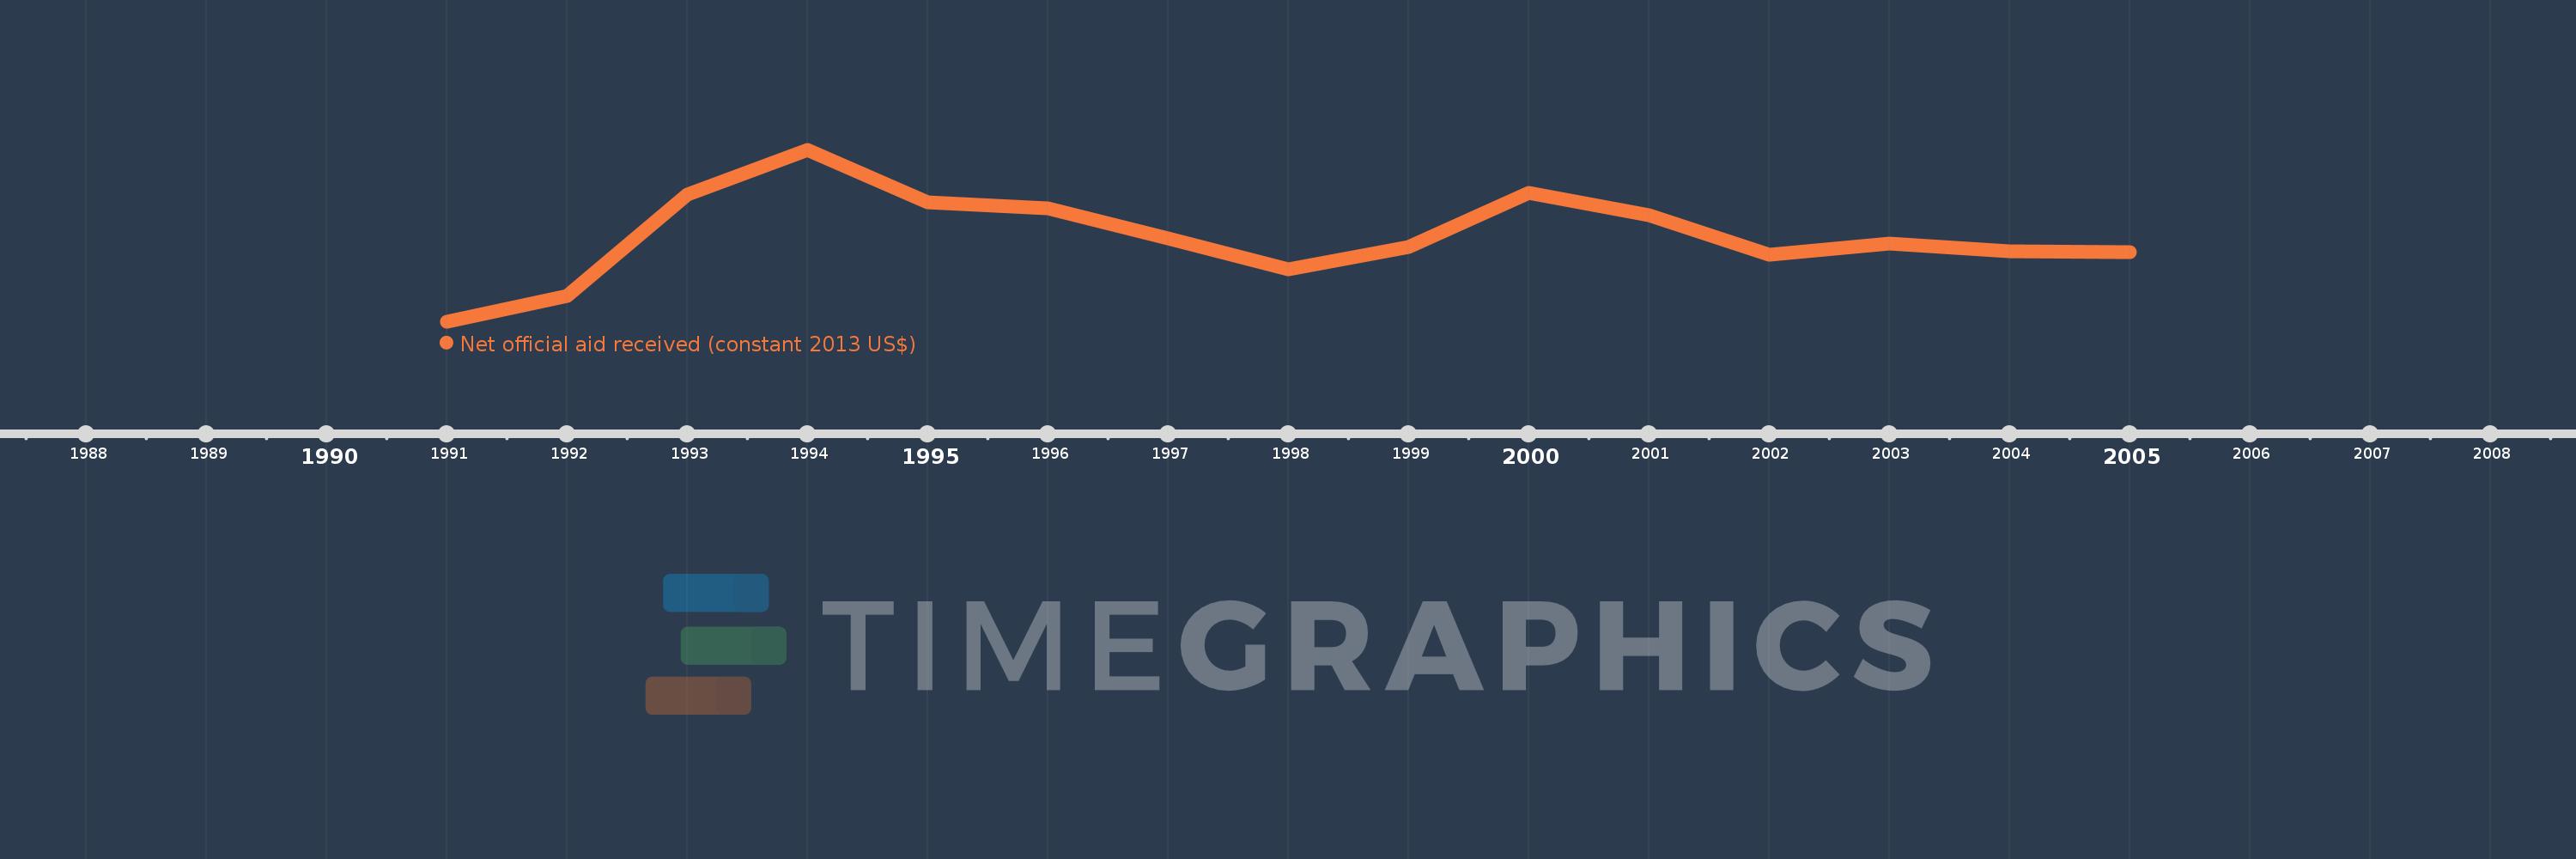
This timeline shows a graph from 1991 to 2005 of Russian Federation. No data until 1990. Number of actual observations by date: 15.
Source name:
World Development Indicators
Source organization:
Development Assistance Committee of the Organisation for Economic Co-operation and Development, Geographical Distribution of Financial Flows to Developing Countries, Development Co-operation Report, and International Development Statistics database. Data are available online at: www.oecd.org/dac/stats/idsonline.
Categories, topics:
Aid Effectiveness
Last updated:
apr 23, 2017
Indicators value changes by year
Meaning:
1.939 bln
Minimum:
383.97 mln
jan 1, 1991
Maximum:
3.489 bln
jan 1, 1994
At the date of observation
Value
Absolute change
Change from the previous value
jan 1, 1991
383.97 mln
+383.97 mln
0.0%
jan 1, 1992
860.08 mln
+476.11 mln
124.0%
jan 1, 1993
2.68 bln
+1.82 bln
211.64%
jan 1, 1994
3.489 bln
+808.46 mln
30.16%
jan 1, 1995
2.547 bln
-942.21 mln
-27.01%
jan 1, 1996
2.439 bln
-107.39 mln
-4.22%
jan 1, 1997
1.892 bln
-546.84 mln
-22.42%
jan 1, 1998
1.329 bln
-563.4 mln
-29.77%
jan 1, 1999
1.742 bln
+412.54 mln
31.04%
jan 1, 2000
2.718 bln
+976.69 mln
56.08%
jan 1, 2001
2.308 bln
-410.3 mln
-15.09%
jan 1, 2002
1.597 bln
-710.56 mln
-30.79%
jan 1, 2003
1.801 bln
+203.83 mln
12.76%
jan 1, 2004
1.657 bln
-144.48 mln
-8.02%
jan 1, 2005
1.641 bln
-15.96 mln
-0.96%
Ranking of countries by current statistics by years